Curated OER
Navigating Around the United States
Pupils calculate mileage and determine how long a trip take and what stops are necessary as they plan a vacation within the United States. They take money, food, lodging and gas into account for budgeting purposes.
Curated OER
Planning a Trip from Vancouver BC
Students plan a weekend car trip to Seattle Washington. They leave Friday afternoon and arrive back Sunday afternoon.
Curated OER
"Homecoming" by Cynthia Voigt
Students use estimation skills to calculate distance traveled and then calculate walking rate traveled in MPH.
Curated OER
FUN WITH MAPS
Fifth graders learn map skills by showing the routes they travel from home to school and using that data to practice map reading and interpreting geographical information.
Curated OER
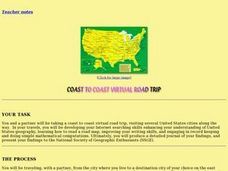
Coast to Coast Virtual Trip
Young scholars complete a variety of exercises and activities as they plan a coast to coast trip across America. They keep a journal that includes where they went, what they did, what they saw, etc. They compare two cities they visited...
Curated OER
Celebrating 100 Years of Negro Leagues Baseball
Ninth graders locate original locations of Negro Leagues Baseball teams using latitude and longitude, calculate distances between locations using maps and/or Internet resources, and use critical thinking skills to compare and contrast...
Curated OER
Mapping Your Community
Students define the boundaries of their community by comparing the community's official boundaries with other historical, political, physical, and perceived boundaries of the area and create a community map.
Curated OER
What Is That Bubblin¿¿¿ In My Back Yard?
Students create a map plotting local sites the Environmental Protection Agency has on its EPA Regulated Sites list. They discuss the need for citizens to, at a minimum, be aware of potential pollution hazards in their community.
Curated OER
Map Skills
Students construct a road map using map pieces precut by the teacher. They apply geometric terms such as rotation and turns. Students apply the use of ordinal directions. They apply a variety of map keys.
Curated OER
Summer Camp in the Classroom
Students explore wildlife plants and summer activities. For this natural science lesson, students identify plants and animals and create a scrapbook of their findings.
Curated OER
Scale Drawings
Students discuss the importance of scaling drawings. In this math lesson, students create a scaled drawing of circuit boards. They explain why accuracy is very important when scaling.
Curated OER
Our Keystone FFA Spring
High schoolers identify where their water sources and explore a watershed on a map. In this watershed lesson students walk a wetland, and identify sources of pollution.
Curated OER
Partition of Africa Questions
In this colonial Africa worksheet, students study a map of Africa from 1885-1914. Students then respond to 9 short answer questions based on the information presented in the map.
Curated OER
Maps in Kindergarten: Rosie’s Walk
Students are read, Rosie's Walk by Pat Hutchins. In this sequencing lesson plan, students discover the importance of knowing how to create a map and read it. They listen to the story and complete various map making activities.
Curated OER
Mapping the Border
Students create maps of the borderland region. They decorate their maps with colors, pictures, icons, scenes, words that reflect their understanding of the character and history of the borderland.
Curated OER
Our Little Town
Students draw a map of their local community using a drawing program. Using the internet, they locate various landmarks and identify famous people living or coming from their town. They participate in interviews with the community...
Curated OER
What Is That Bubblin' In My Back Yard?
Students are introduced to the GIS system. They create a map plotting local sites the Environmental Protection Agency has on its EPA Regulated Sites list. They identify a list of schools that are near potentially hazard sites.
Curated OER
Then and Now
Students list the similarities and differences seen as they compare and contrast historical and current street maps of their local communities.
Curated OER
Compare & Locate via the Internet
Seventh graders compare the location of their home city/town with a town in another country (non U.S.) that they have selected and researched utilizing the Internet. They create a binder of their reports for future research.
Curated OER
Walk and Bike Across America
Students learn how to use maps, compute mileage, and be physically active while exploring America's national parks, historical heritage, and nutritional information via key agricultural sites.
Curated OER
How Long Will It Take To Get There?
Fourth graders estimate the average traveling distance to a city of choice with the help of an internet site. They determine the amount of time it will take to travel there at a speed of 65 miles per hour. Students set up a proportion to...
Curated OER
Tallahassee Project
Sixth graders gather information from technological sources such as TV, radio, and Internet as well as from newspapers and maps and produce a final printed report. They use the data to create a spreadsheet and read a Florida state...
Other
Mapquest
Find website allows you to get step-by-step walking or driving directions to your destination and to avoid traffic with optimized routes. It will also give you information about hotels, food, gas, shopping, etc. along the route or nearby.
Houghton Mifflin Harcourt
Holt, Rinehart and Winston: World Atlas: Philippines
This map of the Philippines from MapQuest is a clear map labeling the cities, islands, and physical features. There is also a chart of some quick facts about the country.

