Curated OER
Plotting Earthquakes
Students plot earthquakes on a map. In this instructional activity on earthquakes, students will explore recent earthquake activity in California and Nevada. Students will plot fault lines and earthquake occurrences on a map.
Curated OER
Grid Frame Mapping
Students map and describe small area of the schoolyard and discuss habitats.
National Wildlife Federation
Quantifying Land Changes Over Time Using Landsat
"Humans have become a geologic agent comparable to erosion and [volcanic] eruptions ..." Paul J. Crutzen, a Nobel Prize-winning atmospheric chemist. Using Landsat imagery, scholars create a grid showing land use type, such as urban,...
Curated OER
Mapping the Bone Field: An Area and Scale Exercise
Here is an excellent cross-curricular lesson. Learners relate multiplication to area by making a grid on graph paper, and then creating the same grid in real space outside in the school yard.
Curated OER
All About the Animals
Whose footprints are those? After reading Janet Halfmann's book, Little Skink's Tail, young scholars use footprints to determine where on a gridded map certain animals have been spotted. They use the map to answer 3 questions, one...
Curated OER
Making Topographic Maps and Mountain Profiles
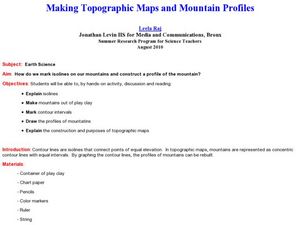
Learners study how to mark inclines and construct a mountain profile. In this topographic map activity students mark contour intervals and draw mountain profiles.
Curated OER
4-figure Grid Reference
Fourth graders study maps and grid lines. In this weather map lesson students complete an activity that allows them to understand grid lines on a map.
University of Southern California
What Is The Ocean?
Go on a tour of the ocean through the lens of a scientist. Learners read maps of the ocean floor, study tide behavior, examine wave motion, and analyze components of soil. Each lesson incorporates a hands-on component.
Curated OER
Cookie Mapping
Students study the components of a bedrock geology map through a hands-on activity involving a cookie and graph paper.
Carnegie Mellon University
Renewables Workshop
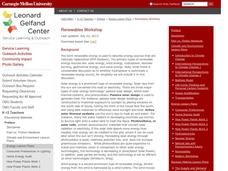
Youngsters examine resource maps to find out which states are using solar and wind power and discuss as a class various other renewable energy sources. They use a provided data table to record pros and cons to each technology, build and...
Curated OER
The O Zone-Code Read Alert
What are the effects of an air quality alert? Expert groups receive one component of air quality information resources to study. Pupils then jigsaw into new groups and share their knowledge. Finally, they draft a statement of what they...
Polar Trec
Global Snow Cover Changes
Snow is actually translucent, reflecting light off its surface which creates its white appearance. Pairs or individuals access the given website and answer questions about snow cover. They analyze graphs and charts, examine data, and...
University of Colorado
Are All Asteroids' Surfaces the Same Age?
There are more than 600,000 asteroids in our solar system. Pupils analyze images of two asteroids in order to determine if they are the same age. They count craters for each asteroid and compare numbers.
Curated OER
Plotting A Hurricane Using latitude and Longitude
Students explore map and plotting skills by tracing the movement s of hurricanes through the Earth's systems. a hurricane map is developed from daily media reports.
Curated OER
Exploration Activities
Students examine the stages in finding, removing, and processing mineral resources. They participate in the "Exploration Hunt" and "Leasing Mineral Rights" activities to better get a handle on their studying.
Curated OER
Paleo-Dig
Pupils will comprehend the use of simple grids and the basic principles and skills used on a paleontological dig, such as the Illampi Mound Colony. They incorporate a systematic investigation. Students analyze a variety of different...
Curated OER
Estimation, Sampling, and Beyond
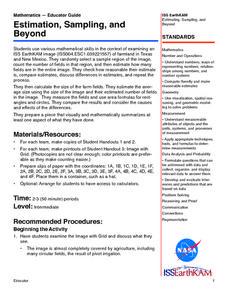
Students examine an ISS EarthKAM image of farm land in Texas and New Mexico. They select sample region of image and count the number of fields in that region. They estimate how many fields are in the entire region.
Curated OER
Hurricane Frequency: Identifying Regions with Similar Numbers of Hurricanes
For this earth science worksheet, students answer 6 questions about the hurricane map and data provided. They create a data table based on the information provided on the map.
Curated OER
Seeing What You Cannot See--RADAR
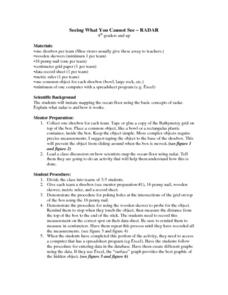
Student imitate mapping the ocean floor using the basic concepts of radar. Then they explain what radar is and how it workds. All of their measurements are recorded on a data sheet. Then the data is entered into a spreadsheet program. A...
Curated OER
LAND USE ISSUES
Students relate math with real life situations. They identify and plot points on a grid map. They identify and locate the Drop Box Sites.
Curated OER
Park Brochures
Sixth graders investigate natural environments by researching national parks. In this brochure making lesson, 6th graders explore a specific national park and research it's information by utilizing the web. Students create travel...
Alabama Learning Exchange
The Sun and the Earth
Third graders study and diagram the positions of the Earth and sun during the four seasons. They predict weather for cities in the northern and southern hemispheres.
Curated OER
Filling in the Picture
Students study archaeological sites. They discover some of the problems inherent in choosing sites and what parts are chosen for excavation. They evaluate and explain their choices for study and articulate the process of archaeological...


