Curated OER
Weather instruments
Students explore weather instruments. In this weather lesson, students make rain gauges, anemometers, and barometers following the instructions given in the lesson. Students set up a weather station using their instruments and record and...
Curated OER
Weather Watchers
Students identify basic weather instruments and how they are used to record weather data. Students define several vocabulary terms as stated in lesson. Students use basic instruments to record weather data in their area. Students use the...
Curated OER
Shedding Light on the Weather with Relative Humidity
Learners study weather using a graphing calculator in this lesson plan. They collect data for temperature and relative humidity for every hour over a day from the newspaper, then place the data in their handheld calculator and examine it...
Curated OER
Weather Tools
Students explore Earth science by participating in a weather identification activity. In this scientific instrument instructional activity, students identify several weather related tools such as the weather vane, thermometer and rain...
Curated OER
Frost Depth Study
Students complete activities to study the frost and frost depth. In this frost study lesson, students use frost tubes to study and measure the frost at their school. Students measure the frost in the tube and enter their data online to...
Curated OER
Air Pressure & Barometers
Fourth graders observe, measure, and record data on the basic elements of weather over a period of time (i.e., precipitation, air temperature, wind speed and direction, and air pressure). Then, they make a barometer and keep record of...
Curated OER
Weather Everywhere
Students gain an understanding of how meteorology affects our physical world and our lives. They utilize resources on web-based activities and participate in the classroom activities to enrich their understanding.
Curated OER
How Wet Did It Get?
Students measure the rainfall/snowfall on the playground on a rainy/snowy day with a rain/snow gauge. They draw a bar graph representing the amount of water that fell and observe a satellite image of the clouds and local weather system...
Curated OER
Air Pressure is Powerful
Students construct a barometer and collect data on the changes in air pressure. They work is small groups using plastic tubing, corks, and green food coloring. They then use a formula to convert inches of mercury to barometric pressure...
Curated OER
Quadratic Functions and Stopping Distance
Students solve quadratic equations. In this algebra lesson, students factor and graph quadratic functions. they use the properties of quadratics to calculate the distance.
Curated OER
Celsius Tells Temperature, Too
Second graders become aware that thermometer liquids expand or contract as temperature affects them.
Curated OER
Chronic Conics
Fourth graders use two activities to draw four different conic sections. One activity is of a physical nature and one is traditional paper and pencil.
Texas Instruments
Texas Instruments: Numb3 Rs: Markov Chain Links
Based off of the hit television show NUMB3RS, this activity introduces students to the concept of Markov Chains, and shows students how to find the probability of something (dependent) happening in the future, given certain conditions...
Texas Instruments
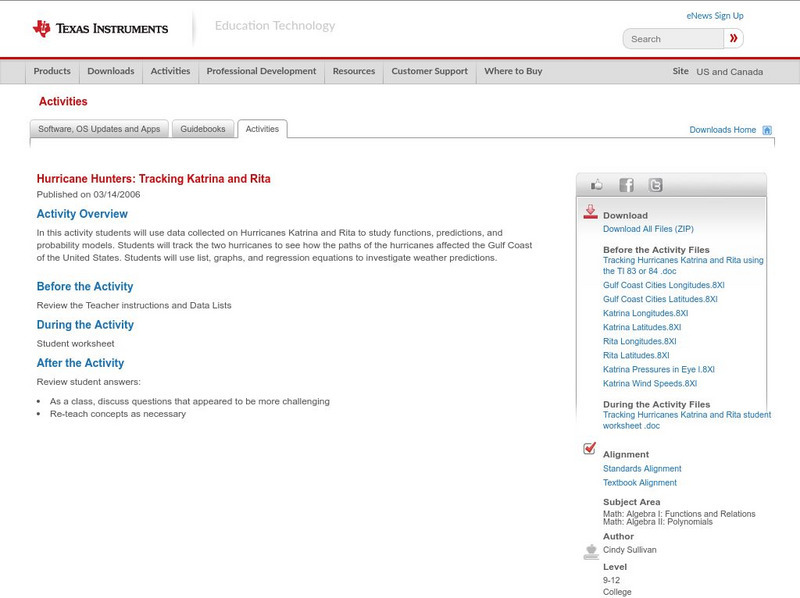
Texas Instruments: Hurricane Hunters: Tracking Katrina and Rita
In this activity students can use data collected on Hurricanes Katrina and Rita to study functions, predictions, and probability models. Students will track the two hurricanes to see how the paths of the hurricanes affected the Gulf...


