Curated OER
Graph and Compare the Adventure's Temperature Vs. Local Temperature
Students explore the concept graphing data. In this graphing data lesson, students use weather data from their local weather and some other city and graph them. Students plot the local weather vs. another city. Students record...
Curated OER
Graphs Abound
Students create a survey for their classmates to collect data on their favorite foods, eye color, pets or other categorical data. They compile the data from the survey in a table and then make a bar graph of each category using a web tool.
Curated OER
Technology: Programming Graphics
Students use the DrScheme program to create graphics for clip art. Using graphics, they plan their designs using basic shapes, plotting its positions, and studying the relationships between points. By plotting the necessary data on...
Curated OER
Confusing Colors!
Fourth graders collect data, graph their data, and then make predictions based upon their findings. They's interest is maintained by the interesting way the data is collected. The data collection experiment is from the psychology work of...
Curated OER
Introduction to "As You Like It"
Students explore the character relationships and their connection in the play "As You Like It." Working in groups, students act out the various scenes from the play and discuss the characters and their actions in the scene. Students...
Curated OER
Graphing Review
Young scholars review the principles of graphing linear functions. They discuss plotting points on a coordinate plane, solving using a table, and then graphing. Students solve problems and determine the slope of the line, y-intercept...
Curated OER
Points In the X-Y Plane
Students plot points on the x-y plane using x and y coordinates and describe how the x and y values relate to the position of the point on the plane. They plot points that fit a linear relationship. They explain that their horizontal and...
Alabama Learning Exchange
The Composition of Seawater
Students explore the concept of finding the composition of seawater. In this finding the composition of seawater instructional activity, students make a saturated salt water solution. Students discuss why there is variation...
Curated OER
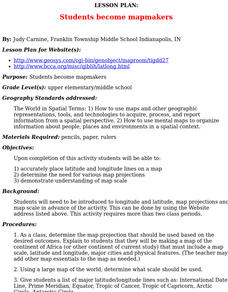
Students Become Mapmakers
Learners practice making a map of a continent and correctly plotting five cities on that map. They place latitude and longitude lines on a map, determine the need for various map projections and explain why map scales are necessary.
Curated OER
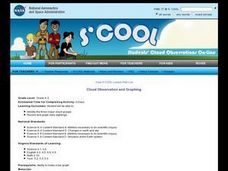
Cloud Observation and Graphing
Students identify the three major cloud groups. They are introduced to the three main cloud types and spend a week making and recording observations of clouds. Students produce a graph that presents their findings and conduct research...
Curated OER
Graph Made Easy-Pre Test Questions
In this graphing pre test instructional activity, students complete a set of 10 multiple choice questions. Page is labeled as a pretest, an answer link is provided.
Curated OER
Wing Specifications
Ninth graders use FoilSim to fulfill the specifications of a given airfoil (wing) and plot and interpret graphs.
Curated OER
Mass & Velocity Effect
Students, after reading the explanation given below, use FoilSim to complete the activity to fulfill the specifications of a given airfoil and then plot and interpret graphs.
Curated OER
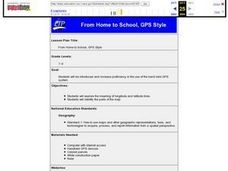
From Home to School, GPS Style
Students are introduced and increase proficiency in the use of the hand held GPS system. They explore the meaning of longitude and latitude lines, then identify the parts of the map.
Curated OER
Give Me a B: North Dakota Quarter Reverse
Students examine the North Dakota quarter reverse and note the bison. and Badlands displayed on it. After practicing as a group making the B sound, they explore the classrom for more words beginning with that letter. Working in pairs,...
Curated OER
Big Apple, Here We Come
Students role play the role of immigrants coming to America for the first time. They complete an imaginary trip with their family and must rent a car and make seven stops along the way. They calculate distances and use maps to...
Curated OER
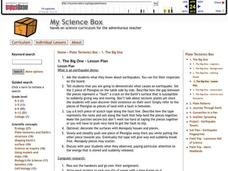
The BIG One
Students observe an earthquake demonstration. They research an earthquake and use color dots to plot the location of each of their earthquakes on the large map.
Curated OER
What is Hamlet Thinking?
Students explore Hamlet's character. In this Shakespeare lesson, students read the selected lines from Hamlet and write any unusual or difficult phrases. Students highlight the names of characters who speak the lines and underline words...
Curated OER
Writing a Fictional Narrative
Fourth graders write a fictional narrative using the computer. They can use files to help them focus on including a beginning, middle and end, characters, setting and plot or planning a story by answering questions.
Curated OER
Human Evolution
Students make and use observations of Laetoli footprints to provide clues to life in the past. They collect and analyze data to study the relationship between foot length and body height.
Curated OER
Go the Distance
Students work together to build lego cars. They make predictions about how fast they believe the cars will go. They record their observations and discuss their results.
Curated OER
Freedom Train North
Fourth graders conduct a novel study of the book Freedom Train North. They identify the parts of a story that include beginning, middle, and end. Students also recognize the setting, plot, and theme after reading a part of the book daily.
Curated OER
Loggerhead Nest Management Program
Students identify the sea turtle management documentary and complete an activity for each slide. They plot the location of nests laid on the island they patrol and discuss their rationale for management decisions. Finally, students...


