Curated OER
Graphing Data Brings Understanding
Students collect, graph and analyze data. For this statistics lesson, students use circle, pie, bar and lines to represent data. They analyze the data and make predictions bases on the scatter plots created.
Curated OER
Linking Real World Data to the Classroom
Young scholars analyze data representing real life scenarios.In this algebra lesson plan, students collect, plot and analyze data using a graph. They use different methods to represent and present their data.
Curated OER
Using Computers to Produce Spreadsheets and Bar Graphs
Students review graphing terminology and how to plot data points, how to input data into a spreadsheet, and how to make a chart using a computer.
Curated OER
Graphing Climate Information
Seventh graders plot the data for the average monthly precipitation for three cities. They make a graph using a spreadsheet.
Curated OER
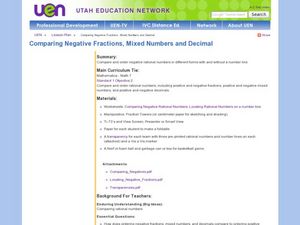
Comparing Negative Fractions, Mixed Numbers and Decimal
Seventh graders explore the concept of negative rational numbers. In this negative rational numbers lesson plan, 7th graders discuss similarities between positive and negative rational numbers. Students predict what rational numbers lie...
Curated OER
Statistics Newscast in Math Class
Students study sports teams, gather data about the teams, and create a newscast about their data. In this sports analysis lesson, students research two teams and define their statistical data. Students compare the two teams, make...
Curated OER
What's The Point?
Students solve word problems using the correct math symbols. For this algebra lesson, students use the TI calculator to graph their equation and analyze it. They find the line of regression and use to draw conclusion.
Curated OER
Comparing and Ordering Integers
Students compare and order integers on an umber line. In this algebra lesson plan, students differentiate between positive and negative numbers. They plot point in the correct order on a number line.
Curated OER
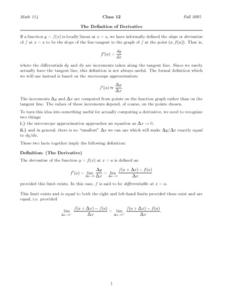
The Definition Derivative
In this derivative activity, students evaluate limits, factor equations, and calculate the given function. They determine the derivative of a function and plot it on a graph. This four-page activity contains eight problems.
Curated OER
You Can't Judge a Book by Its Cover
In this You Can't Judge a Book by Its Cover worksheet, students answer 6 questions about a book they read. An example question includes, "How correct were your predictions about the characters?"
Curated OER
Getting A Grip On Graphs
Fourth graders investigate the concept of graphing and comparing different types of data using pictographs, line graphs, scatter plots, etc... They gather data and make interpretations while examining the medium of how it is displayed.
Curated OER
Modeling Population Growth
Learners collect data on population growth. In this statistics lesson, students graph their data and make predictions. They find the linear regression and the best fit line.
Curated OER
Linear and Nonlinear Functions
Students identify properties of a line. In this algebra instructional activity, students differentiate between functions and nonfunctions. They use the slope and y intercept to graph their lines.
Curated OER
Making Inferences and Drawing Conclusions
Second graders make several inferences based on the reading of Shel Silverstein poems. They write their own poetry and complete an assessment in which they differentiate between sentences that are stated or inferred.
Curated OER
Graphs
Pupils participate in a lesson plan exploring the concept of using graphs in various types of mathematical problems. They use negative and positive numbers in order to plot a graph. Students should use a place value chart for a reference...
Curated OER
Springs 2
In this springs worksheet, learners use paper clips, rubber bands, weights, and more to make springs. Students follow 6 directions, put answers in a chart, and complete 1 question on their own.
Curated OER
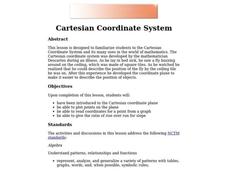
Cartesian Coordinate System
Students explore the Cartesian coordinate plane and plot points on the graph. They interpret coordinates for a point from the graph and give the ratio of rise over run for slope.
Curated OER
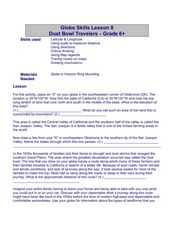
Globe Skills Lesson 8 Dust Bowl Travelers
Students develop their globe and map skills, In this geography lesson, students examine the Dust Bowl as they complete an activity that requires them to plot latitude and longitude.
Utah Education Network (UEN)
Integers on a Coordinate Plane
Boogie fever! Explore the concept of integers on coordinate plane. For this integers on a coordinate plane lesson, students graph rational numbers on the coordinate plane and identify coordinates of a point. Students perform a line dance...
Curated OER
The Big One
Eighth graders study earthquakes. In this earthquake instructional activity students research the Internet on earthquakes and plot earthquake locations.
Curated OER
Reviewing the Romance
In this reviewing the romance worksheet, students research the secrets of writing a romance. Kids read at least 20 modern romance novels. Students identify the structure around the story, looking at plot and characters and style of writing.
Curated OER
What Happened to the Mean and Median
Learners find the mean, median and mode. In hs statistics lesson, students collect, plot and analyze data. The identify the effect the central tendency have on the data and line.
Curated OER
Saving the Bald Eagle
Students plot on a coordinate plane. In this algebra lesson, students identify points on a coordinate plane and graph lines given coordinate pairs. They create a model as they study bald eagles and their growth and decay.
Curated OER
Globe Skills Lesson 6 The Louisiana Purchase
Students explore the Louisiana Purchase territory. In this geography skills lesson, students use map skills in order to plot and note latitude and longitude, measure scale distance, and locate landforms that were part of the Louisiana...


