Curated OER
Creating Circle Graphs with Microsoft Excel
Students create graphs of circles. In this geometry lesson, students use Microsoft Excel to create graphs. They construct the graphs using paper and pencil as well as the computer.
Curated OER
Creating Circle Graphs using Excel
Fifth graders evaluate data from a circle graph that compares time spent on various activities. They use the computer to manipulate their own data as they compare, examine, create and evaluate data using circle graphs.
Curated OER
Students Favorites
Students complete activities using a frequency table and construct a pie graph for the data. In this frequency table lesson, students complete a survey to find data for a frequency table. Students use the given link to make a pie graph...
Curated OER
How Big Is Your Head?
Students explore measurement by measuring classmates' heads. They record their measurements and they put the measurements in order from smallest to largest. Students figure the mean, median, mode, maximum, minimum, and range of their...
Earth Watch Institute
Entering Local Groundhog Data in an Excel Spreadsheet
Here is a cross-curricular ecology and technology activity; your learners create spreadsheets depicting the location and number of groundhog dens in a local park. They research groundhogs and analyze data about where the groundhog...
Curated OER
Get the Picture with Graphs
Fifth graders examine line, bar and circle graphs in the newspaper and on the Internet. They complete sketches of graphs with an emphasis on selecting the best model to depict the data collected.
Curated OER
Creating Circle Graphs with Microsoft Excel
Seventh graders will learn how to construct circle graphs using paper and pencil. Then they will learn how to construct circle graphs using Microsoft Excel. This lesson uses technology and shows learners how to cross skills into the...
Curated OER
Excel Lesson Plan Coin Statistics
Second graders determine the difference between making a prediction and determining actual information. They design a spreadsheet for a coin flipping activity on which they include their predictions and what actual happens when they flip...
Curated OER
Meats Make Muscles
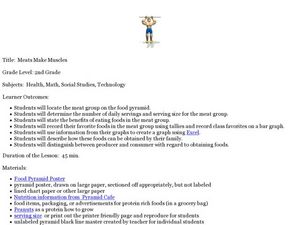
Second graders explore the meat group of the food pyramid. In this nutrition and diet lesson, 2nd graders study the benefits of eating foods in the meat group, collect data regarding their classmates' favorite foods, and create a graph...
Code.org
Making Data Visualizations
Relax ... now visualize the data. Introduce pupils to creating charts from a single data set. Using chart tools included in spreadsheet programs class members create data visualizations that display data. The...
Curated OER
Valentine Heart Candy
Each student gets a box of candy Valentine hearts. The students open the box and count how many of each colored heart they have in their box. The students use this information to make a bar graph and answer follow-up questions.
Curated OER
Data Analysis Challenge
In this data analysis worksheet, young scholars work with a partner to collect information for a survey. The information is then compiled into a graph. Students must indicate their survey question, the target audience, predict the...
Curated OER
Pets Galore!
Fourth graders conduct a class survey on the number of pets that the 4th grade owns and they record that data in their math notebooks. They make a bar graph displaying the results using a spreadsheet through Microsoft Excel.
Curated OER
The Numbers Tell the Story
Students demonstrate how to gather and interpret statistical data. In this data analysis instructional activity, students search for statistics on the health effects of smoking and place the information into charts. Students create these...
Curated OER
Reading Graphs
Students read graphs and charts to interpret results. In this algebra lesson, students interpret bar, line and pictographs. They draw conclusions and make predicitons based on these charts.
Curated OER
Graphing Data on Ellis Island
Third graders use data to make a bar graph. In this graphing and social studies lesson, 3rd graders use data about where Ellis Island immigrants came from to complete a bar graph on Microsoft Excel.
Curated OER
Excel temperature Graphs
Students gather data about the weather in Nome, Alaska. In this Nome Temperature lesson, students create an excel graph to explore the weather trends in Nome. Students will find the average weather and add a trend line to their graph.
Curated OER
Bunny Cakes and Graphing
Third graders graph and analyze data relating to the book "Bunny Cakes" by Rosemary Wells. They listen to and discuss the book, vote on their favorite cake using Excel computer software, and discuss the results.
Curated OER
Line Graphs
Seventh graders create a line graph and identify when to use line graphs. In this line graphs instructional activity, 7th graders analyze the average temperatures of various cities. Students graph the data they collected.
Curated OER
Using Averages to Create Graphs Through Excel
Sixth graders create and use a spreadsheet to make graphs which will be used to analyze Progress Report and Final Report Card grades. They practice finding the mean, median, mode, and range of a data set. Students also incorporate column...
Curated OER
Name Count and Graph
Young scholars find the frequency of a name in selected states by using the Internet. They input data into a spread sheet. They create a graph that illustrates the gathered information.
Curated OER
Among the Hidden - Population Math Activity
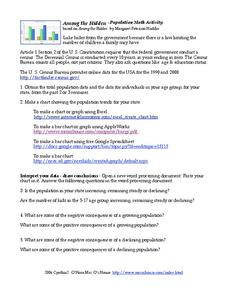
In this population worksheet, students collect data on population by researching the Census Bureau and then make online graphs and answer short answer questions about the data. Students complete 5 problems total.
Curated OER
Food for Thought
Third graders conduct a survey of their class' favorite foods voting on 3-4 favorites overall. They then go to the computer lab and examine how to produce a horizontal bar graph by graphing the favorite foods of the class.
Curated OER
Our Favorite Season Lesson Plan
Fifth graders complete a survey about their favorite season of the year. Using Excel, they create a graph using the chart wizard and copy it into Microsoft Word. They explore the relationship between the survey and the bar graph.


