Curated OER
Is Charleston Your Lucky Charm?
Students determine what makes Charleston, West Virginia unique. In this West Virginia history lesson, students explore the West Virginia History Museum to identify why Charleston became the capitol of the state.
Curated OER
The Quadratic Formula
Students solve quadratic function by completing the square. In this algebra lesson, students use the quadratic formula to factor quadratics and find the roots. They graph the parabola and identify its properties.
Curated OER
Which Bag is Which?
Students explore number sense by completing a statistical analysis game in class. In this data graphing lesson, students utilize visual references such as colored cubes and tiles to map out the results of an experiment outcome such as a...
Curated OER
Data Analysis, Probability, and Discrete Mathematics: Lesson 4
Eighth graders investigate the concepts of probability while performing data analysis. They apply statistical methods in order to measure or predict some possible outcomes. The information is collected and graphed, 8th graders analyze...
Curated OER
Crustal Sinking
Students measure the rate of sinking of a test tube into a beaker of "glop", representing a model of the interaction between the Earth's crust and upper mantle. This task assesses students' abilities to make simple observations,...
Curated OER
The Sixties Protests and Social Change
Students identify, examine and analyze photographs of the sixties to determine the forces of social change at work in America during this decade. They determine the goals of each movement and the methods used by each to achieve those goals.
Curated OER
Urban Planning: Plan a City
Students analyze the concept of urbanization by planning the placement of some of the major urban/suburban features that make up most cities. They arrange the cultural features to benefit the people who live there, and maintain respect...
Curated OER
Linkages Between Surface Temperature And Tropospheric Ozone
Learners collect and interpret data to make predictions about the levels of ozone in the atmosphere. Using the internet to collect data students use their collected data to create a line graph for analysis. Learners make mathematical...
Curated OER
Money Bags
Students compare budgets of various federal agencies and graph the monetary relations between these top-funded agencies. They propose alternate budgets and justify their own monetary priorities.
Curated OER
Squares and Cubes
Middle schoolers recognize, analyze, and use square color tiles and interlocking cubes to discover patterns in perimeter, area, and volume. They will then chart and graph their results.
Curated OER
Identifying Implications
Pupils read a variety of reading passages and articles. They investigate how to make implications and assumptions using the information provided.
Curated OER
Discovering the Problem of Solid Waste
Students catagorize the types of garbage from going through a trash can provided by their teacher. They then chart the items on a graph and propose a solution to reduce the amount of garbage.
Curated OER
Rate of Solution
Eighth graders determine the amount of agitation necessary to dissolve various sized sugar particles. This task assess students' abilities to collect, organize, and interpret data, create appropriate graphs, predict future events based...
Curated OER
Seed Growth
Students develop an independent procedure to investigate the germination of two types of seeds. Students must construct data tables or charts to record observations and results, graph the data, and analyze the data.
Curated OER
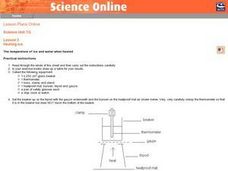
Heating Ice: The temperature of ice and water when heated
Seventh graders read and follow the instructions on the worksheet. They make a table of their results. Students use about 100 cm^3 of water and ice mixture. They heat the water/ice with a Bunsen burner. Temperature is recorded every 30...
Curated OER
Discovering Your Community
Students focus on the origins of the families that make up their community by exploring their family's origins through themselves, parents, and grandparents. Students create a map marked with family origins for the class.
Curated OER
Algebra II: Quadratic Functions
Young scholars collect and organize data, make a scatterplot, fit a curve to the appropriate parent function, and interpret the results. Students translate among the various representations of the quadratic function, formulate equations,...
Curated OER
Bean Plant Growth
Students identify, monitor, and analyze how seeds grow into plants and reproduce seeds at a quick rate. Students record the rate at which plants grow. Students identify what plants need in order to grow. Students share and discuss their...
Curated OER
The Stock Market Game
Students explore the stock market. They choose a company and research the company's financial report. Students select 4-10 stocks and become an advocate for one stock. Using spreadsheet software, students compare stocks. They analyze...
Curated OER
Soil In The Amazon
Students grow plants in soil representing that found in the Amazon basin. They compare results to plants growing in fertile soil and soil fertilized with leaf compost. Students chart, average and graph plant growth by height.
Students...
Curated OER
Comparison of Snow Cover on Different Continents
Students use the Live Access Server (LAS) to form maps and a numerical text file of snow cover for each continent on a particular date. They analyze the data for each map and corresponding text file to determine an estimate of snow cover...
Curated OER
Exploring Infinite Series
Learners analyze geometric series in detail. They determine convergence and sum of geometric series, identify a series that satisfies the alternating series test and utilize a graphing handheld to approximate the sum of a series.
Curated OER
Worm Weather Predicted
Students examine worm habitats. In this animal habitats instructional activity, students participate in a lab activity that requires them to explore the adaptations that earthworms make to their environment.
Curated OER
Sampling Rocks
Students examine sampling by investigating rocks found in the schoolyard. In this sampling rocks lesson students collect and analyze a sample of rocks.


