Varsity Tutors
Varsity Tutors: Hotmath: Practice Problems: Tables and Graphs
Six problems present various aspects of using and making tables and graphs to display statistics. They are given with each step to the solution cleverly revealed one at a time. You can work each step of the problem then click the "View...
Illustrative Mathematics
Illustrative Mathematics: 6.ee Chocolate Bar Sales
n this task learners use different representations to analyze the relationship between two quantities and to solve a real world problem. The situation presented provides a good opportunity to make connections between the information...
Illustrative Mathematics
Illustrative Mathematics: 8.sp.4 Music and Sports
This task looks at a possible relationship between playing a sport and playing a musical instrument. Students collect data from classmates, summarize the data into a two-way table, make some observations, and construct a bar graph of the...
Alabama Learning Exchange
Alex: You Scream, I Scream, We All Scream for Ice Cream !
Fun and yummy lesson to do on a sunny spring afternoon. Have the students take a poll of their favorite choice of ice cream and create a bar graph showing the information. This lesson plan was created as a result of the Girls Engaged in...
Khan Academy
Khan Academy: Make Line Plots
Practice creating line plots (dot plots) from data sets. Students receive immediate feedback and have the opportunity to try questions repeatedly, watch a tutorial video, or receive hints.
TeachEngineering
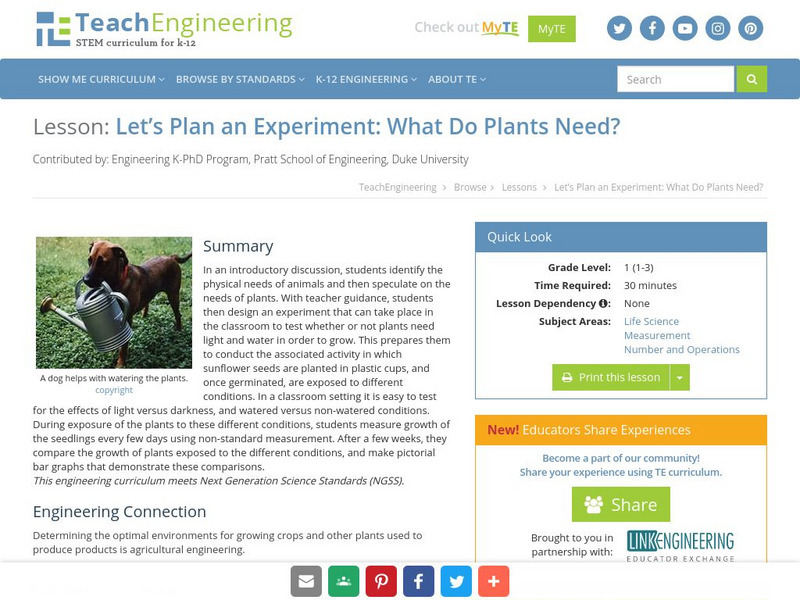
Teach Engineering: Who Needs What?
The teacher leads a discussion in which students identify the physical needs of animals, and then speculate on the needs of plants. With guidance from the teacher, the students then help design an experiment that can take place in the...
PBS
Pbs Lesson Plan: Chances Are Talking Probability (Pdf) [Pdf]
An introductory lesson in probability for learners in grades three to five. The concepts presented in this lesson are interwoven, over time, into a current unit of study. Students examine closely the "language" of probability as used in...
Digital History
Digital History: British Mercantilism and the Cost of Empire [Pdf]
Learn about the theory of mercantilism and how it affected the economies of the New England, Middle, and Southern colonies. Practice making a bar graph showing the value of exports to and imports from England between 1700 and 1774 with...
TeachEngineering
Teach Engineering: A Tornado in My State?
Students will analyze data of tornadoes throughout the United States. They will create a bar graph of the number of tornadoes for the top ten states in the country and then calculate the median and the mode of the data.
PBS
Pbs Kids Afterschool Adventure!: Operation: Data Saves the Day Activity Plan
Data comes to the rescue! Children will collect, analyze, and represent data as they try to dodge a series of catastrophes faced by characters from their favorite PBS Kids shows.
Rice University
Rice University: The Hand Squeeze
Students will enjoy this data collection and class analysis experiment involving the time it takes for a hand squeeze to travel around a circle of people. From organizing the activity to collecting the data to making a table and graphing...
Other
Ohio Department of Education: Third Grade Achievement Test (Practice Test) [Pdf]
Half-length practice test for the third grade OAT (Ohio Achievement Test). The test includes 15 multiple-choice and 5 open-response question dealing with topics such as measurement (time, angles, ruler), data analysis (bar graphs,...
Other
Ohio Department of Education: Fifth Grade Achievement Test (Practice Test) [Pdf]
Half-length practice test for the third grade OAT (Ohio Achievement Test). The test includes 17 multiple-choice and 3 open-response question dealing with topics such as measurement (unit conversion, time), geometry (volume, area), data...
ClassFlow
Class Flow: Collecting and Analyzing Data Using Pedometers
[Free Registration/Login Required] Students will collect and analyze data after wearing a pedometer. They will record data, make a personal bar graph and a class graph. Activotes are used to analyze and discuss the data.
Alabama Learning Exchange
Alex: M&m's and Blogs: Interpreting Data!
In this hands-on, technology-rich lesson, learners will interpret data. The students will define words involving graphs, create a bar graph using M&M's, and post information from their findings on the internet. The learners will also...
PBS
Pbs: The Lowdown: Living Wages in Ca: Ratio and Rate in the Real World
In this KQED infographic, find out how much an adult in different-sized households needs to make to pay for basic monthly living expenses. In the accompanying classroom activity, students solve real-life problems involving rate and ratio...
Other
Stat Soft: Statistics Glossary
Dozens of statistical terms are defined and illustrated in this glossary.


