Curated OER
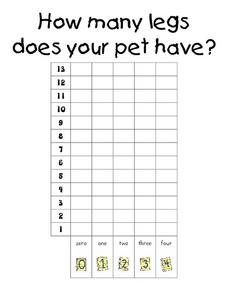
How Many Legs Does Your Pet Have?-- Class Bar Graph
In this math worksheet, students collaborate as a class to make a bar graph displaying how many legs the students' pets have. Results are plotted on the graph.
Curated OER
Graphing
Young scholars investigate graphing. In this bar graph lesson, students view an informational website about graphing, then construct a class birthday bar graph outside with sidewalk chalk. Young scholars choose a survey topic, then...
Curated OER
How Do You Like Your Sandwich? --class Bar Graph
In this math worksheet, students participate in a group bar graph activity. Students survey their classmates on favorite sandwich choices: peanut butter and jelly, grilled cheese or meat. Results are plotted on a bar graph.
Curated OER
Raising the Bar While Hogging the Ham (Radio That Is)
Students create a bar graph that communicates an amount without the need to know the exact data, determine what scale to use to best represent the data and use their bar graph to persuade others.
Curated OER
M&M Graphing and Probability
Students create a variety of graphs. They count, sort, and classify M&M's by color and record data on a chart. They use data from the chart to create pictographs, bar graphs and circle graphs. They analyze data and determine...
Curated OER
Timed Multiplication Test Graphs
Students use the tools of data analysis for managing information. They solve problems by generating, collecting, organizing, displaying histograms on bar graphs, circle graphs, line graphs, pictographs and charts. Students determine...
Curated OER
Pet Count Excel Graphing
Students used collected data to distinguish what pets they have or would like to have. They correlate findings with appropriate technology--Excel. At the end of the lesson they tabulate a bar chart and present their findings to the class.
Curated OER
Graph Frenzy!!
Students brainstorm for a survey question to ask classmates. They survey their classmates. They enter the results into a spreadsheet and create the best graph for the information. They share their graphs with the class.
Curated OER
Use a Graph
In this math graphs worksheet, students use the data within the 'Make-Believe Animals' bar graph to answer the six word problems. Students learn to read the graph and use the numbers to solve the problems.
Curated OER
Many Ways to Represent Our Data
Demonstrate several ways to represent data with your class. They will use surveys to gather data and display the data using tally charts and graphs. Then answer questions according to the data.
Curated OER
“My Little Sister Hugged An Ape” | Literature, Math, & More!
Students read the story "My Little Sister Hugged An Ape" and make a list of sensory words from the story. In this interdisciplinary math lesson, students participate in sensory writing, and complete a questionnaire which they will use to...
Curated OER
Parachute Drop
Learners will have fun creating a parachute to collect data with. They will construct the parachute in small groups, measure the materials, and create an observation sheet. Then they drop the parachute and make predictions about how long...
Curated OER
Survey Says...
Young statisticians collect, organize, and present data to illustrate responses to a survey question. They write and conduct the survey. They finish by presenting the results in the form of a graph.
Curated OER
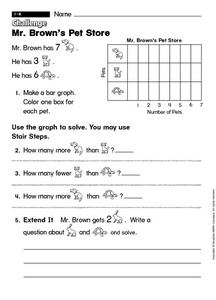
Mr. Brown's Pet Store
In this early childhood problem solving worksheet, students make a bar graph with the provided information and then use the graph to solve 4 problems.
Curated OER
'The Flood'
Students hear the story "The Flood," and take a survey of the favorite pet animals in the class. They take the information complied in the survey and make a bar graph to show favorite pet animals using the computer program KidPix.
Curated OER
Evaporation Experiment- Desert Science Graph
In this science worksheet, students make a bar graph about desert evaporation. The directions say to use the "data from your recording data page" to display information on the graph.
Curated OER
Elastic Forces
Third graders predict and experiment to discover the amount of force exerted by a stretched elastic band. They construct a spreadsheet and make a bar graph showing the results of their experiment.
Curated OER
Valentine Heart Candy
Each student gets a box of candy Valentine hearts. The students open the box and count how many of each colored heart they have in their box. The students use this information to make a bar graph and answer follow-up questions.
Curated OER
Graph Lab
Seventh graders explore bar graphs and pie charts. Given a pack of M&Ms, 7th graders explore the colors, sort the data in a frequency chart and then construct bar graphs and pie charts to categorize the M&Ms by color. Students...
Curated OER
An "Average" Golf Score
Ninth graders investigate mean, median, and mode. In this mean, median, and mode lesson, 9th graders research gold data for the top ten scores in two golf tournaments. Students make tables and graphs of the data. ...
Curated OER
Speed
Fifth and sixth graders practice working in pairs to determine whether they can walk with constant speed. They test themselves, collect their data, draw graphs with their data collected, manipulate the data, and then draw conclusions...
CK-12 Foundation
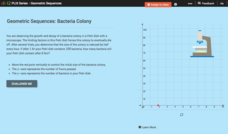
Geometric Sequences: Bacteria Colony
Show budding mathematicians how to model a diminishing bacteria colony two ways—graphically and algebraically. Using the coordinate axis, pupils create a graph to represent the decay of a bacteria colony. They determine the number of...
Curated OER
Graphing With Paper and Computers
Fourth graders construct bar graphs. In this graphing lesson, 4th graders create bar graphs in connection with the story, The Copycat Fish. After creating the initial graphs on paper, students use MS Excel to create graphs.
Curated OER
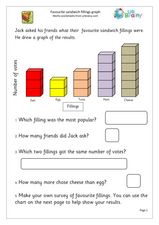
Simple Graph Activity
In this graphing learning exercise, students interpret a simple bar graph of favorite sandwiches, answering 5 related questions and then conducting their own survey and creating a graph of the results.


