Curated OER
Fairytale Favorites
Young scholars access George MacDonald's Fairytales website, read exerpts of pre-selected tales, select their favorite and communicate that information via the internet to another class.
Curated OER
Universal Traditions
Learners research personal bias towards the story Marriage is a Private Affair. For this tradition research lesson, students read the story and discuss the ending. Learners free write about the topic and complete a Venn diagram to...
Curated OER
Understanding Cloud Formation
Pupils explore air and clouds by watching demonstration. They perform an experiment to measure air pressure changes.
Curated OER
Census Data and New Hampshire History
Students graph the population growth of New Hampshire using historical census data.
Curated OER
Streamflow
Students discuss the topic of streamflow and how it occurs. They take measurements and analyze them. They interpret data and create their own charts and graphs.
Curated OER
Understanding Cloud Formation
Students read and relate the poem, "Clouds" by Aileen Fisher to a demonstration on cloud formation. They create clouds in jars using ice water and matches then discuss the ways clouds can be used to predict weather.
Curated OER
Children of Loneliness: Immigration and Intergenerational Stories
Students evaluate Anzia Yezierska's story, "Children of Loneliness," in relation to Jewish immigrants coming to America. They discuss the connections in the story to their own coming to America and their roles as parents. After...
Curated OER
Graphing: Ocean Floor
Students graph the ocean floor using given data. For this earth science lesson, students label different oceanic features on the map. They answer questions at the end of the lab.
Curated OER
Capturing the Wind
Students collect and analyze data about wind speed. They build a Lego wind sail and measure the wind speed with a rotation sensor. They use software to analyze the data.
Curated OER
Introduction to Science
Seventh graders investigate scientific methods to solve problems. They demonstrate creating data tables and graphs. They study the role of a scientist and the importance of safety in a science lab. They distinguish between an...
Curated OER
Drawing Into the Imagination
Sixth graders examine the work of artist Saul Steinberg by visiting online galleries of his work and looking at photo reproductions. After viewing and interpreting Steinberg's work, they write and illustrate fantasy stories which are...
Curated OER
Percentages: Decimals To Percent
In this percentages worksheet, students write twelve decimals as percentages and twelve percentages as decimals. Students check their answers with the key when they are finished.
Curated OER
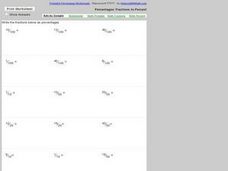
Percentages: Fractions To Percent
For this percentages worksheet, students write eighteen fractions as percentages. Students problem solve each fraction as a percentage.
Curated OER
Superhero Comic Strip Using Greek and Latin Roots
Students create comic strips in groups and explain to the class the Latin and Greek roots of their superhero names. In this Latin and Greek root lesson plan, students get into groups and come up with superhero characters to integrate...
Curated OER
THE AREA OF A CIRCLE
Students examine the relationship between circumference and diameter and how to use the formula to find the area of a circle. In this circle lesson plan students divide into groups and complete an activity.
Curated OER
Australia
Sixth graders study the continent of Australia. In this Geography lesson plan, 6th graders create an Australian city using their knowledge of Australian cities. Students participate in a game about the continent.
Curated OER
Scientific Inquiry: Periodic Motion
Young scholars construct their own pendulum. In this physics lesson, students design an experiment to find the factors affecting its period. They formulate a conclusion based on experimental data.
Khan Academy
Khan Academy: Make Line Plots
Practice creating line plots (dot plots) from data sets. Students receive immediate feedback and have the opportunity to try questions repeatedly, watch a tutorial video, or receive hints.
Khan Academy
Khan Academy: Practice: Make Line Plots
A practice quiz where students construct line plots using the information given in the problems. Includes hints.
CPALMS
Cpalms: Measure Up! Measuring to Make a Line Plot
[Free Registration/Login Required] In this lesson, students will generate measurement data by measuring lengths using rulers marked with halves and fourths of an inch and show the data by making a line plot. This lesson includes an...
Khan Academy
Khan Academy: Line Plots Review
Reviews what line plots are and how to make them. Includes some practice problems with explanations of the solutions.
Illustrative Mathematics
Illustrative Mathematics: Fractions on a Line Plot
Students will play a game with a partner to create a line plot with fractions.
Annenberg Foundation
Annenberg Learner: Making a Stem and Leaf Plot
A line plot may not be a useful graph for investigating variation so we must come up with a new representation based on groups of data. Construct a stem and leaf plot from a set of 26 data values.
Khan Academy
Khan Academy: Creating Box Plots
More practice making box plots to summarize data sets. Students receive immediate feedback and have the opportunity to try questions repeatedly, watch a video or receive hints.

