McGraw Hill
Glencoe: Self Check Quizzes 2 Circle Graphs
Use Glencoe's Math Course 2 randomly generated self-checking quiz to test your knowledge of circle graphs. Each question has a "Hint" link to help. Choose the correct answer for each problem. At the bottom of the page click the "Check...
CK-12 Foundation
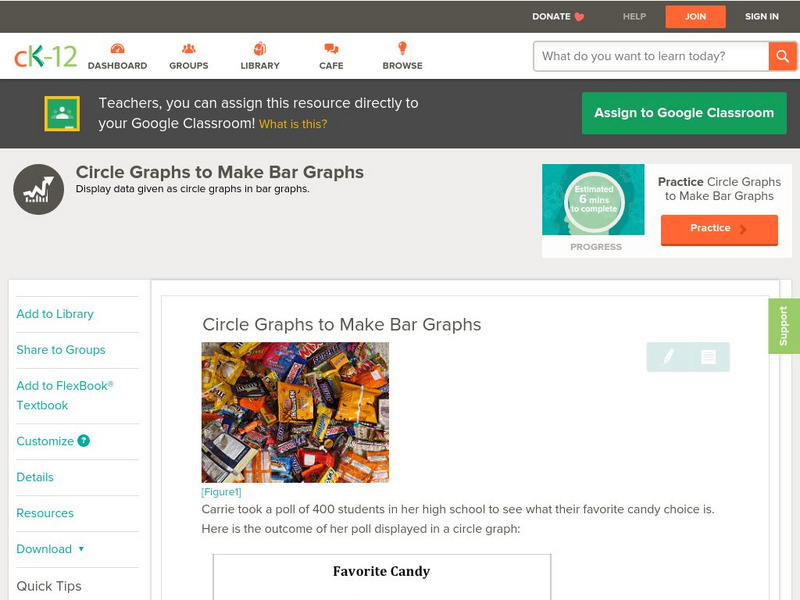
Ck 12: Statistics: Circle Graphs to Make Bar Graphs
[Free Registration/Login may be required to access all resource tools.] Create a bar graph using data displayed in a circle graph.
CK-12 Foundation
Ck 12: Statistics: Circle Graphs to Display Data Grade 7
[Free Registration/Login may be required to access all resource tools.] Make circle graphs by using given data.
Texas Instruments
Texas Instruments: Mc Dougal Littell Middle School Math: Making Data Displays
Students will create data displays using a scatter plot and a line graph of the data and a circle graph of survey data.
Success Link
Success Link: Fruit Loops Graphs
A lesson plan on graphing for young students that can be adapted for older elementary students too. Use Fruit Loops for providing data that can be expressed in many different graphs.
Oswego City School District
Regents Exam Prep Center: Circles and Angles
A wealth of material to supplement classroom instruction on circles, angles in circles, and arcs. Find lessons with formulas, diagrams, and example problems with step-by-step solutions, multiple-choice practice quizzes, and activity...
University of Regina (Canada)
University of Regina: Math Central: Circle and Bar Graphs
Students evaluate data, use the data to make different types of graphs, and then investigate these graphs. Teacher's notes are included along with downloadable versions of the activity. This lesson is from a group of lessons that uses...
Texas Instruments
Texas Instruments: Picturing Probabilities of Number Cube Sums
Students use ideas of ratio and proportion to investigate various ways to make a circle graph. Students create graphs to display the probabilities of the different sums that can be generated with two number cubes. [Requires Adobe Reader.]
CK-12 Foundation
Ck 12: Statistics: Pie Charts Grade 6
[Free Registration/Login may be required to access all resource tools.] Interpret circle graphs and make predictions based on the displayed data.
Other
Laus Dnet: Grade 5 Excel Lesson Plan
In this online instructional activity, young scholars will survey students in their school to determine their favorite type of hand-held ice cream. Before performing the survey, young scholars will make predictions about which ice creams...
Texas Instruments
Texas Instruments: Jason: Leaf Litter, It's a Critter's World
Rainforests at the Crossroads: Use a Berlese Funnel to extract arthropods from leaf litter; count and sort the species of arthropods; and use a TI-73 Explorer to make a circle graph showing the different groups represented in their...
Math Is Fun
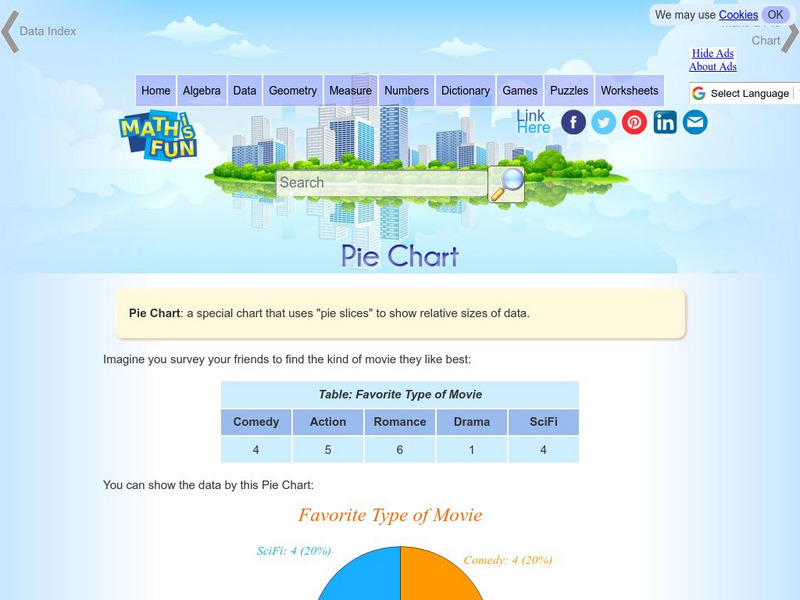
Math Is Fun: Pie Chart
Explains, with examples, what a pie chart is and how to make one. Includes a set of practice questions.
Texas Instruments
Texas Instruments: Why Aren't There More Reds in My Bag?
Students use small bags of M&M's to make predictions, gather data, and display color distribution results in a circle graph. They explore the concept of ratios and sample size.


