Curated OER
How Does it Affect Plants?
Students examine the effects of acid rain on plants. They observe the growth of seeds and the health of different plants for a month. They share their findings with the community.
Curated OER
Mother May I?
Third graders measure distance using nonstandard units of measure. In this measurement lesson, 3rd graders measure a given distance through the use of the game "Mother May I?" Student gather and compare data on how many "giant steps" and...
Curated OER
Seeing Life Through An Artist's Eyes
Students examine how art can change the way they look at their lives. After being read a book, they discuss the importance of art in their world and what would happen if it were taken away. They create a watercolor painting and shares...
Curated OER
A Rainbow Under the Sea: How Do Animals Survive in the Ocean?
Second graders, with adult help, create a PowerPoint presentation on a selected ocean animal.
Curated OER
Tourism in London
Students discuss the tourist attractions that are in London. They examine how data can be manipulated by completing a worksheet. They plan a trip to a London attraction after conducting Internet research.
Curated OER
Olympic Games - Can You Measure Up?
Students complete 6 units to learn about Ancient Greece and the Olympic games through physical education activities as well as math activities. In this Ancient Greece lesson, students complete multiple activities in 6 lessons including...
Curated OER
When You're Hot, You're Not!!
Students investigate volcanoes. In this landforms lesson, students locate two volcanoes on a world map. Students compare and contrast the types of volcanoes by using various Internet sites.
Curated OER
Logarithmic Functions
In this logarithms functions worksheet, students learn about logarithms and answer 13 questions pertaining to logarithms. This worksheet contains the link to a website with additional information.
Curated OER
Big Block of Chocolate
Pupils read the book Big Block of Chocolate and complete language arts activities associated with it. In this language arts lesson plan, learners read the book as a read aloud or shared reading, and can compete writing, reading,...
Curated OER
How Unique Are You?
Students explore how genetic information is passed down from parent to offspring. Because of this, they examine how this causes the variation in each species.
Curated OER
Potential and Kinetic Energy
Sixth graders explore potential and kinetic energy. In this science lesson, 6th graders assume the role of a roller coaster engineer and design a roller coaster. Students use their knowledge of kinetic and potential energy to design a...
Curated OER
A Statistical Look at Jewish History
Students complete their examination over the Jewish Diaspora. Using population figures, they discover the importance of percentages in exploring trends. They use their own ethnic group and determine how it is represented in the United...
Curated OER
Comparison of Snow Cover on Different Continents
Students use the Live Access Server (LAS) to form maps and a numerical text file of snow cover for each continent on a particular date. They analyze the data for each map and corresponding text file to determine an estimate of snow cover...
Curated OER
Water and Ice
Young scholars explore the states of matter. In this physical science lesson, students observe what happens to water when it freezes and record observations. Young scholars then observe ice when it melts and record observations.
Curated OER
A Bird's Eye View of our 50 States
Third graders focus on state birds as they learned absolute location (latitude/longitude) of each state, as well as their relative location (bordering states).
Curated OER
Phenomenal Weather-Related Statistics
Eighth graders research, collect and interpret data about weather statistics. They record that data on spreadsheets. they create Powerpoint presentations on their individual or group research.
Curated OER
Thank You... Thomas Edison!
Students investigate the life of Thomas Edison. They research how he made a difference. They understand that accurate data collection is important for math. They create a chart using spreadsheet data.
Curated OER
Western Hemisphere
Fourth graders use a database to compare countries in the western hemisphere. They describe a variety of regions in Texas and the Western Hemisphere such as political, population, and economic regions that result from patterns of human...
Curated OER
On the Road Again": Moving People, Products, and Ideas
For this lesson learners learn how to identify modes of transportation and communication for moving people, products, and ideas from place to place. Students also study the advantages and disadvantages of different modes of...
Curated OER
Age Structure Studies
Young scholars collect data from Internet sources to compare age distributions in their city, county or state with that of other places in the US or other countries. They construct and interpret age-structure population pyramids and...
Curated OER
Scientific Inquiry: Periodic Motion
Students construct their own pendulum. In this physics lesson, students design an experiment to find the factors affecting its period. They formulate a conclusion based on experimental data.
Curated OER
Spyglass
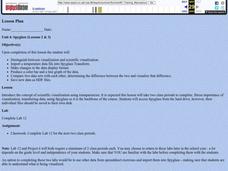
Students distinguish between visualization and scientific visualization. They use the software program Spygalss to create images from two-dimensional arrays of numbers.
Curated OER
Clouds and Solar Radiation
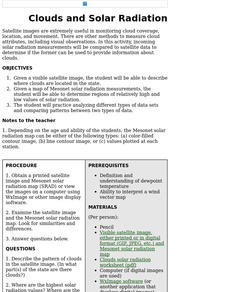
Students examine how clouds affect incoming solar radiation. They compare and contrast satellite images and incoming solar radiation measurements as methods to provide information about clouds.
