CK-12 Foundation
Ck 12: Statistics: Bar Graphs Grade 7
[Free Registration/Login may be required to access all resource tools.] Make a bar graph to display given data.
E-learning for Kids
E Learning for Kids: Math: Traditional African Village: Bar Graph and Data
Help Kyan make a bar graph with the ages of the children in his village.
Primary Resources
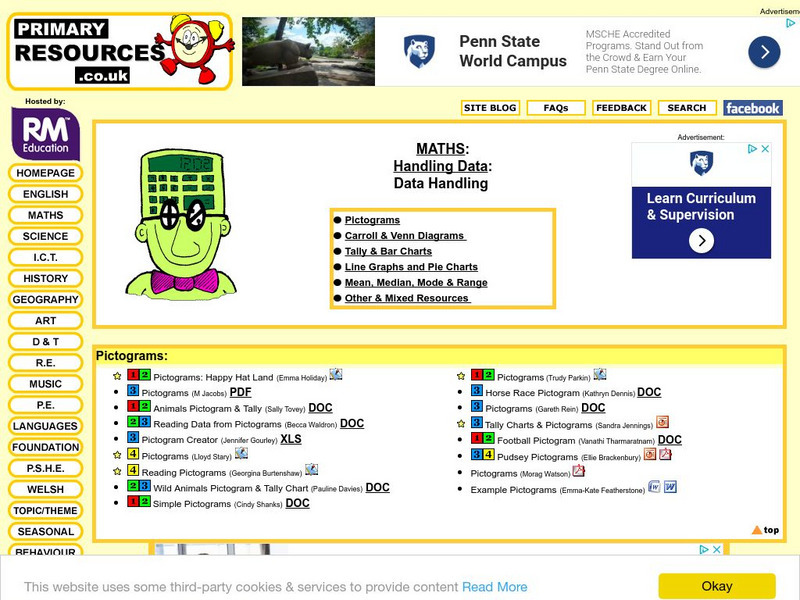
Primary Resources: Tally and Bar Charts
Lots of good materials for teaching about tally marks and bar graphs.
CK-12 Foundation
Ck 12: Statistics: Multiple Bar Graphs Grade 7
[Free Registration/Login may be required to access all resource tools.] Make multiple bar graphs to display and compare data.
National Council of Teachers of Mathematics
The Math Forum: How to Make a Bar Graph
Site contains specific directions for making bar graphs using a Claris Works spreadsheet file.
CK-12 Foundation
Ck 12: Statistics: Bar Graphs Grades 9 10
[Free Registration/Login may be required to access all resource tools.] Make a bar graph to display given data.
Khan Academy
Khan Academy: Make Bar Graphs 1
Practice creating bar graphs (bar charts) from data sets. Students receive immediate feedback and have the opportunity to try questions repeatedly, watch a video or receive hints.
CK-12 Foundation
Ck 12: Statistics: Circle Graphs to Make Bar Graphs
[Free Registration/Login may be required to access all resource tools.] Create a bar graph using data displayed in a circle graph.
Khan Academy
Khan Academy: Make Bar Graphs 1
A practice quiz where students construct bar graphs using the given information. Includes hints.
University of Regina (Canada)
University of Regina: Math Central: Circle and Bar Graphs
Students evaluate data, use the data to make different types of graphs, and then investigate these graphs. Teacher's notes are included along with downloadable versions of the activity. This lesson is from a group of lessons that uses...
Better Lesson
Better Lesson: Graphing Our Snack Mix: Review of Graphing
Second graders review how to make bar graphs, line plots, and pictographs by tallying the contents of snack mix and building graphs to show their data.
Better Lesson
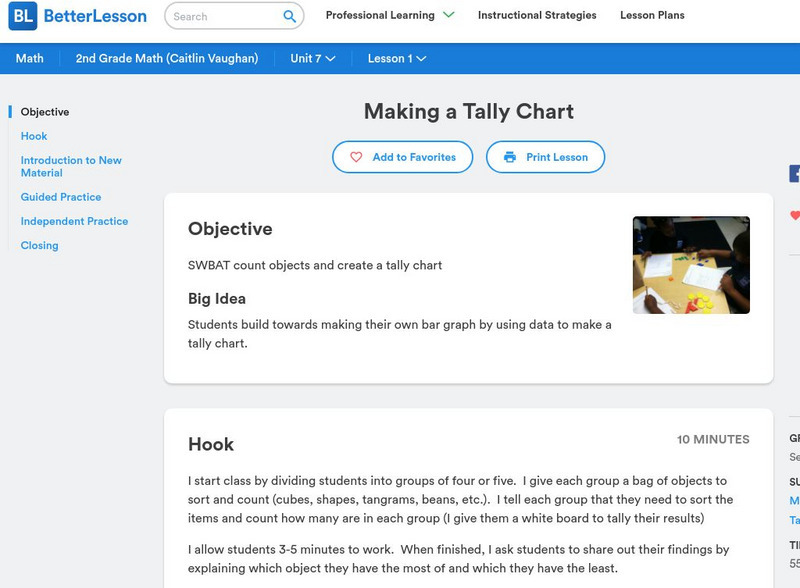
Better Lesson: Making a Tally Chart
Second graders build towards making their own bar graph by using data to make a tally chart.
E-learning for Kids
E Learning for Kids: Math: Music / Dance Performance: Data and Chance Experiments
On this interactive site students use the setting of a dance performance to predict all possible outcomes and make vertical and horizontal bar graphs.
Scholastic
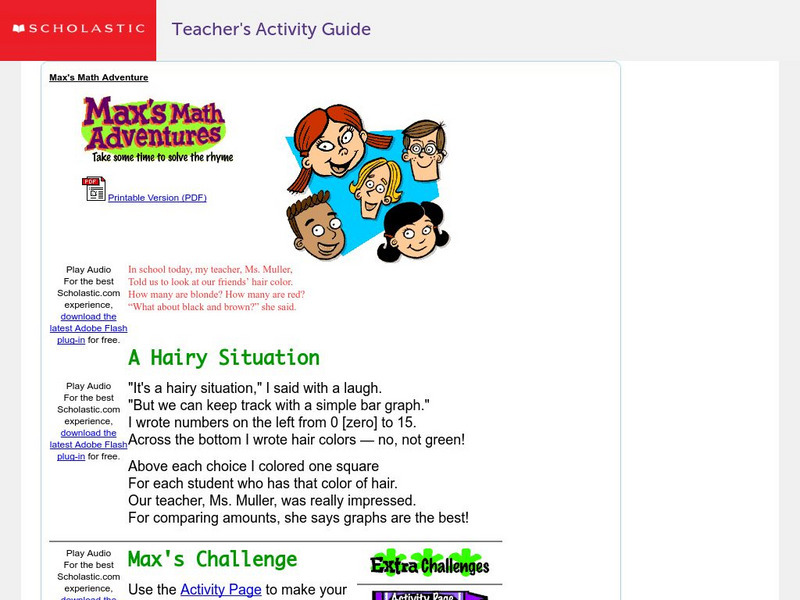
Scholastic: Max's Math Adventures: A Hairy Situation
Help Max make a bar graph to show the hair colors of his classmates. Teachers will appreciate the activities with bar graphs in the extra challenges. Use the teacher's guide to create a fun and engaging lesson.
US Department of Education
Nces: Create a Graph: Kids Zone
Make your own pie, bar, line, area or XY graph with this interactive tool. Look for examples of graphs already created from data collected by the National Center for Education Statistics. Complete with a graphing tutorial.
Success Link
Success Link: Fruit Loops Graphs
A lesson plan on graphing for young students that can be adapted for older elementary students too. Use Fruit Loops for providing data that can be expressed in many different graphs.
National Council of Teachers of Mathematics
Nctm: Illuminations: Bar Grapher
A computer applet that will draw any bar graph with student's data input.
Varsity Tutors
Varsity Tutors: Hotmath: Practice Problems: Tables and Graphs
Six problems present various aspects of using and making tables and graphs to display statistics. They are given with each step to the solution cleverly revealed one at a time. You can work each step of the problem then click the "View...
Illustrative Mathematics
Illustrative Mathematics: 6.ee Chocolate Bar Sales
n this task learners use different representations to analyze the relationship between two quantities and to solve a real world problem. The situation presented provides a good opportunity to make connections between the information...
Alabama Learning Exchange
Alex: You Scream, I Scream, We All Scream for Ice Cream !
Fun and yummy lesson to do on a sunny spring afternoon. Have the students take a poll of their favorite choice of ice cream and create a bar graph showing the information. This lesson plan was created as a result of the Girls Engaged in...
TeachEngineering
Teach Engineering: Who Needs What?
The teacher leads a discussion in which students identify the physical needs of animals, and then speculate on the needs of plants. With guidance from the teacher, the students then help design an experiment that can take place in the...
PBS
Pbs Lesson Plan: Chances Are Talking Probability (Pdf) [Pdf]
An introductory lesson in probability for learners in grades three to five. The concepts presented in this lesson are interwoven, over time, into a current unit of study. Students examine closely the "language" of probability as used in...
Digital History
Digital History: British Mercantilism and the Cost of Empire [Pdf]
Learn about the theory of mercantilism and how it affected the economies of the New England, Middle, and Southern colonies. Practice making a bar graph showing the value of exports to and imports from England between 1700 and 1774 with...
Other
Ohio Department of Education: Third Grade Achievement Test (Practice Test) [Pdf]
Half-length practice test for the third grade OAT (Ohio Achievement Test). The test includes 15 multiple-choice and 5 open-response question dealing with topics such as measurement (time, angles, ruler), data analysis (bar graphs,...


