Curated OER
Geography: Snow Cover on the Continents
Students create maps of snow cover for each continent by conducting Internet research. After estimating the percentage of continental snow cover, they present their findings in letters, brochures or Powerpoint presentations.
Curated OER
Search for Ice and Snow
Learners use satellite images to locate areas of ice and snow on the globe. They create a table showing the information they gathered. They present their information to the class.
Curated OER
Underwater Picture of the Hudson River Estuary
Young scholars identify important aspects of water quality such as slainity and turbidity. They test two of the water quality parameters and determine the quality of the water. In addition, they construct two sets of graphs based on data...
Curated OER
Adventures With Maps And Globes
First graders examine the differences between a map and a globe. They discuss and identify the symbols on maps and globes, then in small groups complete a worksheet. Students then complete a Venn Diagram comparing maps and globes.
Curated OER
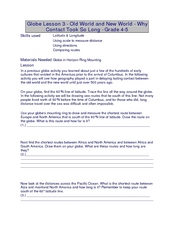
Old World and New World - Why Contact Took So Long
Students use a globe to determine why contact between the old world and the new world took a long time. In this map skills lesson, students analyze routes between regions to determine why it took so long for the old world and the new...
Curated OER
Vocabulary Review: Completing Sentences
For this vocabulary worksheet, students check the word that will correctly complete a sentence, 7 sentences. Students choose from 4 words.
Curated OER
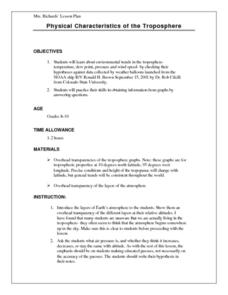
Physical Characteristics of the Troposphere
Pupils lexplore environmental trends in the troposphere- temperature, dew point, pressure and wind speed- by checking their hypotheses against data collected by weather balloons.
Curated OER
Physical Characteristics of the Troposphere
Students examine troposphere graphs and mcompare their hypotheses with data collected by weather balloons launched from the NOAA ship, Ronald H. Brown. they write summaries about the physical properties of the troposphere.
Curated OER
Geographic Effects on Precipitation, Water Vapor and Temperature
High schoolers investigate the factors affecting climate using Live Access Server. In this geography lesson, students graph atmospheric data using Excel spreadsheet. They compare and contrast temperature, precipitation and water vapor of...
Curated OER
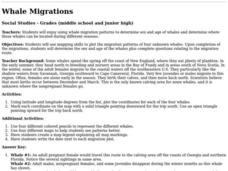
Whale Migrations
Pupils use whale migration patterns to determine sex and age of whales and determine where these whales can be located during different seasons. They use mapping skills to plot the migration patterns of four unknown whales.
Curated OER
Interpreting Satellite Images
Young scholars identify differences between photography and satellite imagery space.
Curated OER
Fossils and Migration Patterns in Early Hominids
Students plot the locations where major fossils of hominids have been found to extrapolate possible migratory patterns.
Curated OER
Naval Warfare in the American Revolution
Students determine speed and bearing, calculate a position by dead reckoning, and modify this position using vectors for wind and current drift.
Curated OER
Circle the Earth - Explore Surface Types on a Journey around Earth
Students use CERES percent coverage surface data with a world map in locating landmasses and bodies of water at Earth's Equator.
Curated OER
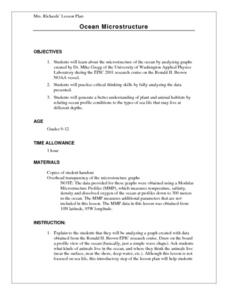
Ocean Microstructure Lesson Plan
Learners explore the microstructure of the ocean by analyzing graphs created by Dr. Mike Gregg of the University of Washington Applied Physics Laboratory during the EPIC 2001 research cruise on the Ronald H. Brown NOAA vessel.
Curated OER
Correlating Atmospheric Data Lesson Plan
Students make and test hypotheses about atmospheric data collected aboard the NOAA ship Ronald H. Brown research cruise.
Curated OER
How Does Climate Affect Your Environment?
Students access the Global Sun Temperature Project website and research the relationship between the location and climate of a participating school to its building structure. They consider how climate affects the type of structures...
Curated OER
Learning About the Shape of the Earth
Seventh graders investigate ways of telling the shape of the Earth and its position in the Universe both historically and today.
Curated OER
Location, Location, Location
Learners use maps to locate their community in order to create a flip book.
Curated OER
Timing the Transit of Venus
Middle schoolers calculate elapsed time and look for patterns.
Curated OER
Lichens as Air Quality Indicators: A beginning lichen identification study (2003
Students use GPS and trees to explore lichens and air quality.
Curated OER
Testing Soils for Garden Planting
Sixth graders collect soil samples and record the location of the samples by using GPS.
Curated OER
Ocean Microstructure
Students assess the ocean's microstructure by analyzing graphs created during tne Ronald H.Brown research cruise. they discuss at what depths various sea animals live and write paragraphs on data analysis from the graphs.
Curated OER
Relative Humidity of Your School
Students predict the location where the relative humidity the highest and lowest in and around their school. They use a sling psychrometer to measure the relative humidity of the various locations.
Other popular searches
- Latitude and Longitude
- Latitude Longitude
- Latitude and Longitude Games
- Latitude & Longitude
- Latitude and Longitude Maps
- Longitude and Latitude Game
- Longitude and Latitude Math
- Geography Latitude Longitude
- Whaling Latitude Longitude
- Longitude Latitude Minutes
- Longitude and Latitude Lines
- Volcano Latitude Longitude


