Curated OER
Heating The Atmosphere
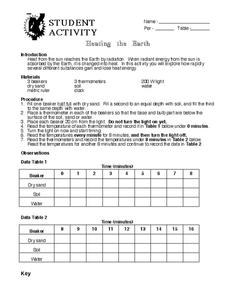
In this science worksheet, high schoolers look for the answers to finding the correct temperatures that match the location in the atmosphere.
Curated OER
Tracking Weather Over Time
Young scholars gather, analyze and interpret data. They explain scientific inquiry. They plot points on a map and report information from a spatial perspective.
Curated OER
Give Me Back My School: A Back to Basics Approach to Ecological Restoration
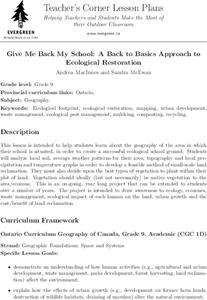
Ninth graders research local geography to create successful, ecological school landscaping. They determine soil type, average weather patterns and temperature graphs and use the information to select ideal plants and plant maintenance...
Curated OER
Using Non-Text Features
Second graders examine graphs and charts from their local newspaper. As a class, they discuss what the data means and how it relates to the article. In groups, they are shown two sets of graphs or charts and they practice explaining...
Curated OER
Valley Forge
Young scholars describe how location, weather, and physical environment affect the way people live, including the effects on their food, clothing, shelter, transportation, and recreation. They also describe the lives of American heroes...
Curated OER
My Habitat Address
Sixth graders draw a habitat and write about what they would need to survive in the habitat. They define the input of items such as materials, energy, and information, and what goes out of the habitat. They play a "Habitat Address" game,...
Curated OER
Central Tendency
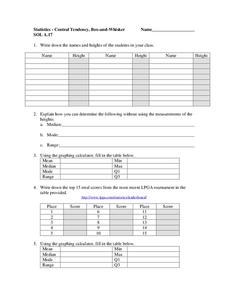
For this central tendency worksheet, students solve and complete 10 different problems that include measures of central tendency. First, they write down the names and heights of students in their class. Then, students explain how they...
Curated OER
Clues to Climate Change
Eighth graders study topics related to global weather patterns and their local effects. They hone their research and presentation skills using online resources content specific tools, and graphing data. They create simple PowerPoint...
Curated OER
Changes Close To Home
Students interview the senior citizens in their community. While interviewing them, they identify perceptions they have about the local climate. Using the internet, the compare the results of the interview to those of public thirty...
Curated OER
Sky Watching
Students trace how weather patterns generally move from west to east in the United States.
Curated OER
Tracking Ozone
Young scholars track an ozone event in Groton, CT. They compare weather changes and the subsequent ozone levels. Also, they make comparisons and determinations about ozone levels.
Curated OER
Using SWMP Data
Pupils are introduced to the SWMP system which tracks short-and long-term changes in water. Using this data, they plot and interpret the data on a graph to determine how human activities are lowering the water quality. They also identify...
Curated OER
Sunrise-Sunset
Pupils gather data, make and share predictions about the time of sunrise ans sunset in their area. Patterns are analyzed and shared with students from other areas.
NOAA
El Niño
El Nino, La Nina ... and the Santa Maria? The 11th installment of a 23-part NOAA Enrichment in Marine sciences and Oceanography (NEMO) program explains the mechanism of El Nino/Southern Oscillation. Pupils use previous data to determine...
Curated OER
Using Vegetation, Precipitation, and Surface Temperature to Study Climate Zones
Students begin their examination of the climate zones found around the world. Using a software program, they identify the relationship between the vegetation, climate and temperatures of the different zones. They also plot coordinates...
Curated OER
Teaching about Diel Temperature Variation
Students explore temperature variation in lakes and deal with the data.
Utah Education Network
Uen: Recording Local Weather
Second graders will measure, record, graph and report changes in local weather utilizing Navajo, Ute, and Spanish words.
Other
Honolulu Hi 5: Cool Maps With Awesome Weather Data Across 1,219 Us Cities
Explore the weather in states and cities across the United States. Two maps with accompanying graphs are provided. The first indicates the number of comfortably warm summer days a place has and the second shows the temperature and how...
Science and Mathematics Initiative for Learning Enhancement (SMILE)
Smile: Aspects of Weather
A detailed weather lesson plan written for the primary, intermediate, and junior high level. Topics covered are weather symbols, thermometer, graphing temperature results, clouds, moisture and air pressure.


