Curated OER
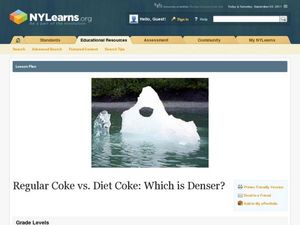
Regular Coke versus Diet Coke, Which is Denser?
Students investigate the density of liquids. For this geometry lesson, students calculate the volume and differentiate between volume, mass and density. They observe similarity and differences between coke and diet coke.
Curated OER
Geometry: Practical Applications of the Distance Formula
Students, working independently and in groups, apply the distance formula to practical situations. After solving various problems, students in pairs design coordinate planes from the school blue print to measure the distance from the...
Curated OER
Taking In The Heat
Students discover that different textured materials can absorb more heat than others. Students work with thermometers, clocks, and graphs.
Pennsylvania Department of Education
Build What I've Created
n this geometric lesson, students define and identify two dimensional shapes based on their attributes. They complete worksheets based on the geometric concepts.
Curated OER
CO2 and You
Young scholars study the scientific evidence about carbon dioxide emissions. They learn to calculate the amount of energy used by different appliances. They complete a worksheet which analyzes the amount of energy that their home uses.
Curated OER
Sorting Sizes
Students follow a pattern. In this sorting lesson, students are given various objects and they must sort them from smallest to largest.
Curated OER
Making Sense of Density
Students identify the concepts of density, mass, and volume that define the property of a substance. They also determine that the properties of materials, such as, density and volume, can be compared and measured by using rulers,...
Curated OER
Tick Around the Clock
Students examine and discuss the differences between clocks they are shown. Using the internet, they research how people used to tell time before clocks. They review what the long and short hand on the clock represent and practice...
Curated OER
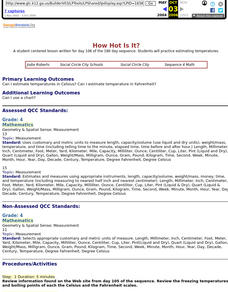
How Hot Is It?
Fourth graders practice estimating temperatures. They practice in Celsius and Fahrenheit.
Curated OER
Chilly Discoveries
First graders make ice cream and determine what makes this liquid turn into a solid.
Curated OER
Bubbles
Eighth graders experiment with a number of dishwashing liquids to determine the duration of the bubbles. They graph the data, add glycerin to the dishsoap, and repeat the experiment. They graph and compare the data sets.
Curated OER
Crazy Putty Ratio
Second graders use knowledge of measurements and ratios to mix various combinations of liquid starch and glue. They chart their ratios, make observations, and write a summary of the activity. They mix their own batch of Crazy Putty to...
Curated OER
Drip, Drip, Drip
Learners gather scientific data and be able to utilize the data to generalize results over a long period of time. They use the appropriate tools to measure quanities of liquids and analyze the data to determine the cost of a leaky faucet.
Curated OER
Space Exploration
Fourth graders observe an empty 14 oz. clear plastic cup and measure how much water the cup can hold when it is completely full. They work in groups to fill the plastic cup, but half of the groups receive a smaller vial and the other...
Curated OER
Vision Props of Signed Numbers
Students explore the concept of titration. In this titration lesson, students observe acid and alkaline reacting. Students discuss pH factor, measuring acidity, neutrality, and alkalinity of liquids. Students put the pH of liquids on a...
Curated OER
Discovering Pi
Fourth graders are introduced and experiment with the concept of pi. Using this information, they discover the relationship between the circumference and diameter of circles. In groups, they practice measuring the circumference of...
Curated OER
Hidden Jewels of Geometry
Pupils identify different geometric shapes, and arrange them artistically in original jewelry designs.
Curated OER
What is the Best Solution to Dye Easter Eggs?
Students use red and blue litmus paper to determine the category of common substances. They then set up an experiment using vinegar, water, and ammonia (or milk of magnesia) to determine that acids make the best solution for dyeing...
Curated OER
Capacity and Volume
Second graders estimate capacities, compare pints and quarts, and identify pints and quarts.
Curated OER
The Grouchy Ladybug
Pupils complete a Cirlce Map about time. They recall times during the grouchy ladybugs travels, and add dots on ladybugs using turn-around facts. Pupils correctly sequence the events of The Grouchy Ladybug. Students compose new...
Curated OER
Sensational Seasons
Second graders explore how seasonal weather patterns affect temperature and their lives.
Curated OER
The Three Bears: Comparing and Ordering
Students explore comparing and ordering volume of containers. They use the context of Goldilocks and the Three Bears to compare the volume of various containers by packing or pouring.
Curated OER
Bubbles
Third graders perform an experiment using different mixtures of dishwasher detergent. They construct bar graphs that record their bubble data for each detergent set.
Curated OER
A Real Difference
Fifth graders use the Celsius and Fahrenheit thermometers to compare temperature readings. They use the Internet to find the temperatures of selected cities. After data is collected for five days, 5th graders graph the temperatures.


