Curated OER
Looking For Triangles
Students solve problems with triangles. In this geometry lesson plan, students analyze shapes to find different triangles. They name the shapes created by putting triangles together.
Curated OER
Graphing With RXTE
Students use data from the Rossi X-ray Tiiming Explorer (RXTE) satellite to analyze and graph.
Curated OER
Tortillas
Students convert recipes for tortillas. They calculate the amounts of ingredients as they convert recipes and write an explanation of the task to demonstrate their calculations. After reviewing their calculations, they demonstrate how...
Curated OER
Square Milk Bottle Crates
Pupils attempt a problem that Students has the potential to have more than one solution. Hence the problem is accessible to a wide range of pupils. The problem is essentially about finding patterns and this is typical of a number of such...
Curated OER
Confusing Colors!
Fourth graders collect data, graph their data, and then make predictions based upon their findings. They's interest is maintained by the interesting way the data is collected. The data collection experiment is from the psychology work of...
Curated OER
Shape Makes a Difference!
Students learn the difference between perimeter and area by watching a video and a hands on activity.
Curated OER
Flow Rates of Faucets and Rivers
Learners work together to discover the flow rates of faucets and rivers. They relate their results to engineering and applied science concepts. They make predictions on the flow rate of a nearby river in their local community.
Curated OER
Wings and Othe Things
Students work in groups that are engaged in different activities at different times. They watch the video "Madagascar" and collect data pertaining to the Fish Eagle's arm spam. They work together to perform mathematical computations...
Curated OER
Rows of Numbers
Students generate patterns from a structured situation, find a rule for the general term, and express it in words and symbols. They also devise and use problem solving strategies in a systematic way.
Curated OER
Poppy Meets Pythagoras
Eighth graders find connections between numbers in a table; use Pythagoras' theorem in a general algebraic form; and measure accurately from a scale drawing to find a method that might enable the helicopter to land inside a rectangular...
Curated OER
Surface Area and Volume of a Cube
Students explore finding the surface area and volume of cubes and cylinders. They construct similar three-dimensional figures from a two-dimensional drawing. Students derive the formula for volume and surface area through examination...
Curated OER
Perimeters, Patterns, and Conjectures
Students discover patterns and write conjectures relating to perimeters and polygons. Working in cooperative learning groups, they use manipulatives and graphic organizers to solve problems then answer a series of questions in which they...
Curated OER
Bubble Gum Chemistry
Students explore the concept of graphing data. In this graphing data lesson, students determine the percentage of sugar in bubble gum. Students graph type of gum vs. sugar percentage. Students create a table of their data.
Curated OER
Building Paper Bridges
Students construct a bridge that can hold 100 pennies. In this math lesson, students evaluate the strength of their bridges. They predict how much weight a bridge can hold based on its design.
Curated OER
Harnessing the Wind for Electricity
Ninth graders explain how wind can produce electricity. In this geometry instructional activity, 9th graders construct their own pin wheel turbine and calculate its power. They discuss the pros and cons of using wind generator.
Texas Education Agency
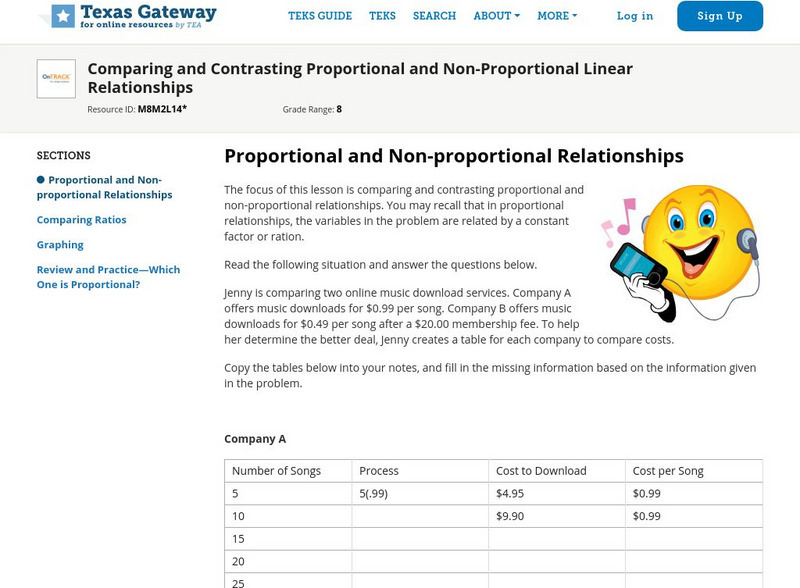
Texas Gateway: Proportional and Non Proportional Linear Relationships
Given problem solving situations, the student will solve the problems by comparing and contrasting proportional and non-proportional linear relationships.
University of Waterloo (Canada)
Univ. Of Waterloo: Wired Math: Linear Graphing: Graphing and Analyzing [Pdf]
The mathematics resource assesses students on linear relations. The activity has problems with graphing and analyzing linear relations. Some of the topics included are variation, scatter plots and linear relationships. The worksheet has...
Vision Learning
Visionlearning: Linear Equations in Science: Relationships With Two Variables
An introduction to the history of linear equations and how they relate to science.
Texas Instruments
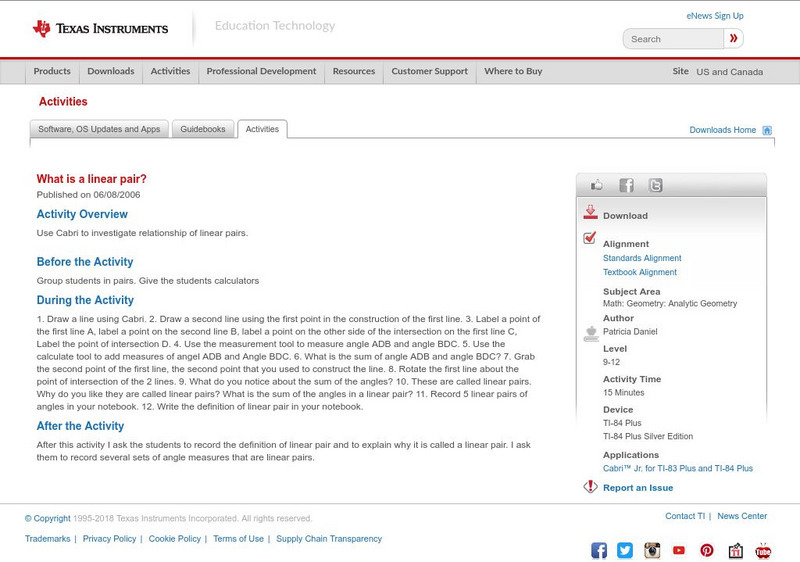
Texas Instruments: What Is a Linear Pair?
Use Cabri to investigate relationship of linear pairs.
CK-12 Foundation
Ck 12: Geometry: Linear Pairs
[Free Registration/Login may be required to access all resource tools.] Solve linear pair problems.
Sophia Learning
Sophia: Finding Rates of Change in Linear Relationships: Lesson 3
This lesson demonstrates how to find the rate of change in functions with linear relationships. It is 3 of 5 in the series titled "Finding Rates of Change in Linear Relationships."
Georgia Department of Education
Ga Virtual Learning: Linear Motion
A learning module where students gain an understanding of the relationships between the different kinds of motion. Students will be able to explain free-fall motion and use kinematics equations to calculate problems involving falling...
Other
Linear Functions, Slope and Regressions
Find activities here for linear functions, slopes and regression lines. Use them for classroom work or individual assignments.
Varsity Tutors
Varsity Tutors: Hotmath: Algebra Review: Linear Pairs
Find a quick, concise explanation of linear pair. Examples are given and clearly explained.
Other popular searches
- Rates Linear Relationships
- Linear Pair of Angles
- Geometry Linear Pair
- Linear Pair Postulate
- Graphing Linear Relationships
- Non Linear Relationships


![Univ. Of Waterloo: Wired Math: Linear Graphing: Graphing and Analyzing [Pdf] Unknown Type Univ. Of Waterloo: Wired Math: Linear Graphing: Graphing and Analyzing [Pdf] Unknown Type](https://static.lp.lexp.cloud/images/attachment_defaults/resource/large/FPO-knovation.png)


