Hi, what do you want to do?
Duke University
Duke University: Web Feats Ii: Lessons on Regression at Hessian
This site has several lessons on regression, "Designed to help students visualize topics associated with lines of regression, given a set of data points." Go to the teacher notes to find the objectives and standards which apply.
Texas Instruments
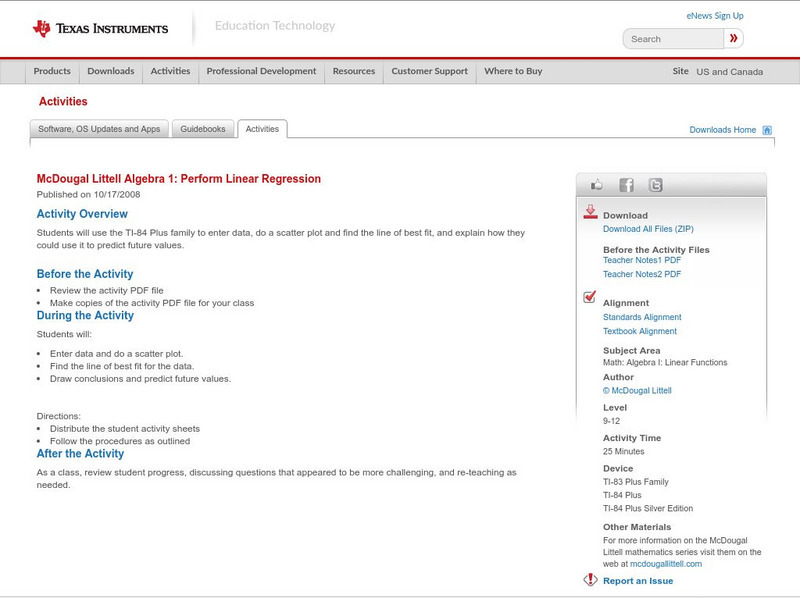
Texas Instruments: Mc Dougal Littell Algebra 1: Perform Linear Regression
Students can use the TI-84 Plus family to enter data, do a scatter plot and find the line of best fit and explain how they could use it to predict future values.
Texas Instruments
Texas Instruments: Muddy Footprints Adventure 11
In this adventure, students will analyze the relationship between height and stride length, and then use that information to identify the biker who left the footprints. They create a scatter plot, find the linear regression equation for...
Other
Graph Pad: Data Analysis Resource Center
The GraphPad Statistics Guide is both a guide to doing statistical analyses with GraphPad Prism 7, and a concise review of statistical principles, emphasizing clear explanations with very little math. The GraphPad Curve Fitting Guide is...
University of South Florida
Fcat: Bungee M&m's: Teacher Notes
Students will learn how to draw a line of best fit for a set of data using m&m's and a "Bungee."
University of South Florida
Fcat: Shaq's Hand/foot Span: Teacher Notes
Students compare their own hand/foot span to Shaquille O'Neal's, then graph the data & construct a best-fit line. They can then use the information to investigate the proportionality of the human body.
Texas Instruments
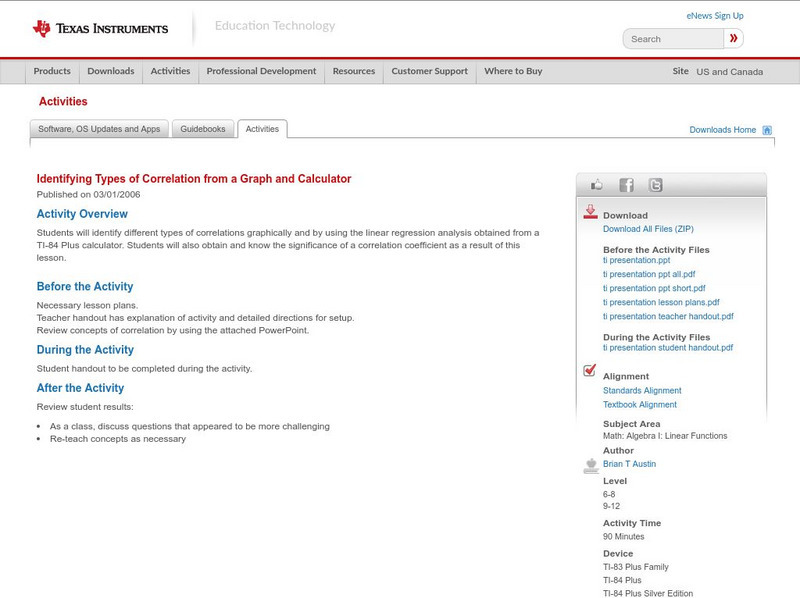
Texas Instruments: Identifying Types of Correlation From a Graph and Calculator
Students will identify different types of correlations graphically and by using the linear regression analysis obtained from a TI-84 Plus calculator. Students will also obtain and know the significance of a correlation coefficient as a...
Texas Education Agency
Texas Gateway: Modeling Data With Linear Functions
Given a scatterplot where a linear function is the best fit, the student will interpret the slope and intercepts, determine an equation using two data points, identify the conditions under which the function is valid, and use the linear...
Texas Instruments
Texas Instruments: Ball Bounce
This activity allows students to use real data obtained by them to model quadratic equations. students can use the TI-83 and/or TI-84 and a motion detector to collect their data. The students will then manually fit both quadratic and...
Concord Consortium
Concord Consortium: Trees in a Diagnosis Game
In this dynamic data science activity, students use data to build binary trees for decision-making and prediction. Prediction trees are the first steps towards linear regression, which plays an important role in machine learning for...
Texas Instruments
Texas Instruments: Do You Have a Temperature?
In this activity, students represent and analyze climate data. They use linear regressions to understand the relationship between temperatures measured in the Fahrenheit and Celsius scales and examine conversion factors.
Texas Instruments
Texas Instruments: Greenhouse Gas Emissions
In this activity, students analyze statistical data using the calculator and the TI InterActive! software. They use linear regression to study the increase in levels of carbon dioxide emission over the years.
McGraw Hill
Glencoe Mathematics: Online Study Tools: Self Check Quiz on Linear Functions
The online assessment demonstrates knowledge of advanced mathematical concepts in Algebra II. The questions test students on linear functions. Topics include modeling real-world data with linear functions, scatterplots, and regression...
Texas Instruments
Texas Instruments: Bivariate Data
This set contains statistics questions regarding bivariate data: scatter plots, the least-squares regression line, and their interpretation. The student is asked about the meaning of the various strengths and directions of linear...
Texas Instruments
Texas Instruments: Use the Regression Feature to Find a Line of Best Fit
This tutorial shows you how to enter a set of data and find the line of best fit.
Texas Instruments
Texas Instruments: Numb3 Rs: Mapping Fireprints
Based off of the hit television show NUMB3RS, this diverse lesson has students perform linear regression analysis (to compare two fire variables), check three-dimensional points using a planar equation, and evaluate points to determine...
Texas Instruments
Texas Instruments: Exponential Models and Logarithmic Scales
In this activity, students will analyze exponential growth data and then switch to a logarithmic scale. Includes both an exponential and a linear regression on the data, and asks students to make connections between two forms of...
Texas Instruments
Texas Instruments: Numb3 Rs: Less Is More
Based off of the hit television show NUMB3RS, this two-part lesson begins by having students try to find the line of best fit for a given set of data (strike outs vs. home runs). The second part of the lesson shows how least squares...
Texas Instruments
Texas Instruments: Women's 5000 M World Record Progression: Median Median Line
In this activity, students will collect the Women's 5000 meter progression of world record data and find the median - median line and the linear regression for the data. They will investigate the appropriateness of each of the models.
Texas Instruments
Texas Instruments: Burning Volumes
An analysis of how the volume of various jars impacts the burning time of candles. Data collected will be used to explore modeling, line fitting and linear regression Using graphing calculators.
Texas Instruments
Texas Instruments: Canadian Life Expectancy
In this activity, students analyze statistical data Using the calculator and the TI-InterActive! software. They perform regression on the data to find the life expectancy of people in Canada.
Texas Instruments
Texas Instruments: Exploring the Golden Arches
Using given nutritional information of popular items from McDonald's, the students will develop and test a conjecture based on the given information. The students will analyze the two-variable data using the graphics calculator by...
CK-12 Foundation
Ck 12: Algebra: Applications of Function Models
[Free Registration/Login may be required to access all resource tools.] In this lesson students draw a scatter plot of data, find and draw the function that best fits that data, and make predictions from that information. Students watch...
Texas Instruments
Texas Instruments: Exploring Circles
Explore the relationship between the center and radius of a circle and the equation of the circle. Collect data and determine regression equations related to various combinations of data, and use the regression equations to make...


