West Contra Costa Unified School District
Correlation and Line of Best Fit
Computers are useful for more than just surfing the Internet. Pupils first investigate scatter plots and estimate correlation coefficients. Next, they use Microsoft Excel to create scatter plots and determine correlation coefficients and...
Curated OER
Exploring Function Graphs
Tenth graders investigate three different sets of data that relate temperature to another variable in the physical world. These illustrate linear, inverse and exponential relationships.
Curated OER
Line of Best Fit
Students explore the concept of linear regression. In this linear regression lesson, students do a Barbie bungee activity where they collect linear data. Students plot their data using a scatter plot. Students determine a line of best...
Curated OER
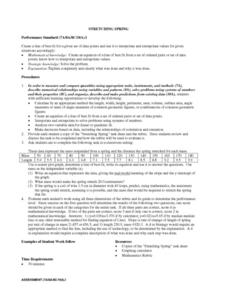
STRETCHING SPRING
Students calculate the length, width, height, perimeter, area, volume, surface area, angle measures or sums of angle measures of common geometric figures. They create an equation of a line of best fit from a set of ordered pairs or...
Curated OER
A Study of a Quadratic Function
Students factor and solve quadratic equations. In this algebra lesson, students play a game as the collect and graph data. they identify properties of their parabola and make predictions.
Curated OER
How Much Will I Spend On Gas?
Students construct a linear graph. In this graphing lesson, students determine a monthly budget for gasoline. Students construct a t-chart and coordinate graph to display data. Resources are provided.
02 x 02 Worksheets
Inverse Variation
Discover an inverse variation pattern. A simple lesson plan design allows learners to explore a nonlinear pattern. Scholars analyze a distance, speed, and time relationship through tables and graphs. Eventually, they write an equation to...
Curated OER
Another Way of Factoring
Focusing on this algebra lesson, learners relate quadratic equations in factored form to their solutions and their graph from a number of different aspects. In some problems, one starts with the original equation and finds the solutions....
Curated OER
Moving Straight Ahead
Students analyze the relationship between speed, time and distance. In this math lesson, students plan a school trip. Students determine the efficiency and cost effectiveness of a trip.
Curated OER
Putting Your Money to Work
Students create a collect data on expenses. In this algebra lesson, students create a spreadsheet to solve scientific equations. They incorporate math, science and technology in this lesson.
Curated OER
Optimization For Breakfast
Students identify he proportion of a cereal box. In this algebra lesson, students define the relationship between patterns, functions and relations. They model their understanding using the cereal box.
Curated OER
Highs and Lows
Solve problems using integration and derivatives. By using calculus, learners will analyze graphs to find the extrema and change in behavior. They then will identify the end behavior using the derivatives. Activities and handouts are...
Curated OER
Odd and Even
Explore the concept of odd and even with your class using this resource. Learners take an online test demonstrating their knowledge of odd and even, sing a song about the concept, and engage in computer-based activities.
Curated OER
Cover and Boarders
Students find the area and perimeter of rectangular figures. They use this information to find patterns and discover relationships between area and perimeter. Students apply and explain formulas relating to perimeter, area, and volume.
Curated OER
Adding and Subtracting Algebraic Expressions (Combining Like Terms)
Everyone loves math when it includes food! This activity tries to take the notion of combining like terms in algebra and comparing it to sorting apples and oranges. It takes a step-by-step approach to helping students understand this...
Curated OER
Rate of Change
Young scholars observe and calculate slopes. In this algebra lesson, students graph equations and determine the pace at which the slope is changing. They use the navigator to see the change as they graph the lines around.
Inside Mathematics
Graphs (2006)
When told to describe a line, do your pupils list its color, length, and which side is high or low? Use a worksheet that engages scholars to properly label line graphs. It then requests two applied reasoning answers.
Curated OER
Maximize It!
Students design a rectangular box without a lid that has the largest possible volume using the supplied sheet of centimeter graph paper. They work in groups to construct different size boxes to determine the largest possible volume and...
Curated OER
Exploring Quadratic Equations
Eleventh graders explore quadratic equations. In this Algebra II lesson, 11th graders use Geometer’s Sketchpad to explore the properties of quadratics and the connections with polynomials and linear equations. The lesson is designed as...
Curated OER
Graphs involving Exponential Functions
In this algebra worksheet, students graph exponential functions and analyze it for growth and decay. There are 9 problems with an answer key.
Curated OER
Solving Equations Using Two Operations
Need more detail in showing your class how to solve two-step equations and proportions? This lesson plan outlines the steps young mathematicians need to solve simple equations and check their results.
Curated OER
Practicing Arithmetic
Students practice single operation arithmetic ranging from single digit addition to long division of decimals or real numbers using Graphit. They use data sets and rules to graph ordered pairs.
Alabama Learning Exchange
The State Capital of Stem and Leaf
Students explore the concept of stem and leaf plots. In this stem and leaf plots lesson, students plot the 50 US states' capitals on a stem and leaf plot according to the first letter of each state. Students compare their stem and leaf...
Curated OER
What's The Point?
Learners solve word problems using the correct math symbols. In this algebra lesson, students use the TI calculator to graph their equation and analyze it. They find the line of regression and use to draw conclusion.


