Curated OER
Comparing Costs
Students compare the costs of two cellular phone plans and determine the best rate. They use a table and a graph of points plotted on a Cartesian plane to display their findings. Students write an equation containing variables that could...
Curated OER
Giant Mystery
Third graders determine the relationship between hand size and body size using centimeters as the unit of measure, They use the relationship to find the size of a hypothetical giant. They graph the measurements using a spreadsheet program.
Curated OER
Equations Lesson Plan
Seventh graders play "What's my Rule" beginning with simple equations and working towards harder problems as student's gain confidence. They evaluate the equations by graphing them. Students identify the slope and y intercepts of the...
Curated OER
Properties of Logarithms
Eleventh graders investigate logarithms. In this Algebra II lesson, 11th graders explore the properties of logarithms that are used to simplify expression and solve equations. Students confirm their conjectures regarding the properties...
Curated OER
Solving Equations Using Two Operations
Need more detail in showing your class how to solve two-step equations and proportions? This lesson plan outlines the steps young mathematicians need to solve simple equations and check their results.
Curated OER
Introduction to Scatter Plots and Correlation
Learners examine the concept of scatter plots. They compare baseball statistics to locate the ones that correlate with winning, and identify the positive, negative, and no correlation in sets of data using MS Excel.
Curated OER
Graphing and the Coordinate Plane
Students learn about the Cartesian coordinate plane, understand the four quadrants of the Cartesian coordinate plane, and plot points on the plane. Students read coordinates for a point from a graph and give the ratio of rise over run...
Curated OER
Reading Graphs
Students practice plotting functions on the Cartesian coordinate plane, see several categories of functions, including lines and parabolas, and read a graph, answering questions about the situation described by the graph
Curated OER
Reading Graphs
Students plot functions on the Cartesian coordinate plane. They explore lines and parabolas. Students analyze graphs and answer questions about the information presented on the graph using an online program.
Curated OER
My Peanut Butter is Better Than Yours!
Learners explore the concept of statistical data. In this statistical data instructional activity, students read an article about the dangers of peanut butter to those who are allergic. Learners perform a taste test of two different...
Alabama Learning Exchange
The State Capital of Stem and Leaf
Students explore the concept of stem and leaf plots. In this stem and leaf plots lesson, students plot the 50 US states' capitals on a stem and leaf plot according to the first letter of each state. Students compare their stem and leaf...
Curated OER
What's The Point?
Learners solve word problems using the correct math symbols. In this algebra lesson, students use the TI calculator to graph their equation and analyze it. They find the line of regression and use to draw conclusion.
Curated OER
Simple Sequence
Students identify the nth term in a sequence. In this algebra lesson, students generate sequences given the formula for each sequence. They find the formula given the sequence.
Curated OER
Exploring Arrangements of 2, 3, 4, and 5 Cubes
Students use problem solving skills to create various models of tricubes, tetracubes, and pentacubes. They classify the cubes into various groupings and identify them as mirror images, regular arrangements, and irregular arrangements....
Curated OER
The Mandelbrot Set
Students are introduced to the notion of a complex number and function iteration in order to motivate the discussion of Julia sets and the Mandelbrot set.
Curated OER
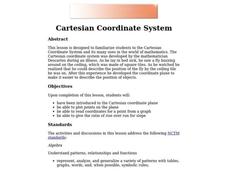
Cartesian Coordinate System
Students explore the Cartesian coordinate plane and plot points on the graph. They interpret coordinates for a point from the graph and give the ratio of rise over run for slope.
Curated OER
The Quadratic Formula
Students solve quadratic function by completing the square. In this algebra lesson plan, students use the quadratic formula to factor quadratics and find the roots. They graph the parabola and identify its properties.
Curated OER
Between The Extremes
Students analyze graphs for specific properties. In this algebra lesson, students solve equations and graph using the TI calculator. They find the different changes that occur in each graph,including maximum and minimum.
Curated OER
Pascal's Triangle
Students study Pascal's triangle. They construct their own version of Pascal's triangle, and relate some of the uses for it. While working through this process, students practice their integer multiplication and division skills.
Curated OER
A Study of a Quadratic Function
Students factor and solve quadratic equations. In this algebra lesson, students play a game as the collect and graph data. they identify properties of their parabola and make predictions.
Curated OER
Means of Growth
Students collect and graph data. In this statistics lesson, students analyze their plotted data using a scatter plot. They identify lines as having positive, negative or no correlation.
Curated OER
Walking on Air
Students collect and analyze data with a graph. In this statistics lesson, students use central tendencies to find the meaning of their data. They display the data on a Ti calculator.
Curated OER
Writing a Function Rule
In this Algebra I/Algebra II worksheet, students determine the equation that correctly represents the relationship between the x and y values provided. The one page worksheet contains four multiple choice problems. Answers are not...
Curated OER
Investing
Learners collect data on investments and draw conclusions. In this algebra lesson, students analyze exponential graphs as they relate to money. They discuss the cause of an account balance being high or low.
Other popular searches
- Linear Patterns Word Problem
- Linear Patterns Graphing
- Linear Patterns and Graphs
- Linear Patterns and Plotting
- Algebra Linear Patterns
- Describing Linear Patterns
- Linear Patterns in Data
- Recognize Linear Patterns
- Extending Linear Patterns
- Growing Linear Patterns
- Simple Linear Patterns
- Non Linear Patterns


