Curated OER
Geometric Probablitiy: Spinners and Dartboards
Sstudents explore and analyze the properties of geometric areas. In this geometry lesson, sstudents use technology to simulate spinners and dartboards in order to fing areas of circles and sectors of circles and compare and...
Curated OER
What are the Odds
Students predict the-outcome of an event. In this algebra lesson, students compare and contrast the probability of an event occurring. They calculate the odds of a simple event and make estimation.
Curated OER
Comparison of Two Different Gender Sports Teams - Part 1 of 3 Measures of Central Tendency
Students gather and analyze data from sports teams. In this measures of central tendency lesson, students gather information from websites about sports team performance. Students analyze and draw conclusions from this data. This lesson...
Curated OER
Slope & Rate of Change
This short handout addresses the concept of slope in two different ways: geometrically and analytically. Start with a brief description of slope, then use graphical representations to compare positive vs. negative slope and zero vs....
Curated OER
Worksheet 1
In this math worksheet, pupils describe the difference between a partial and an ordinary differential equation. They give examples of 1st, 2nd, and 3rd order differential equations. Students apply this information to predator/prey...
Curated OER
Algebraic Relationships
Here are 17 various forms of problems that range from matching equivalent expressions to word problems. Included are problems for substutiing values into expressions and using the order of operations, simplifying algebraic expressions,...
Albert Shanker Institute
Economic Causes of the March on Washington
Money can't buy happiness, but it can put food on the table and pay the bills. The first of a five-lesson unit teaches pupils about the unemployment rate in 1963 and its relationship with the March on Washington. They learn how to create...
Shodor Education Foundation
An Introduction to Arithmetic and Geometric Sequences
Help your class look for patterns as they create their own arithmetic and geometric sequences. Engage learners with an introductory discussion on sequences and use the applet to let them explore how sequences are formed. Teachers might...
Curated OER
Scatter Diagrams and Curve Fitting
In this Scatter Diagrams and Curve Fitting worksheet, students are guided in how to graph a scatter diagram (plot) and a Best Fit Line using a TI-83 graphing calculator.
Shodor Education Foundation
Graphing and the Coordinate Plane
Ready to introduce your class to the coordinate plane? This website includes a detailed lesson plan that includes two interactive games to help learners practice graphing ordered pairs. The scripted discussion is a little cheesy and a...
Curated OER
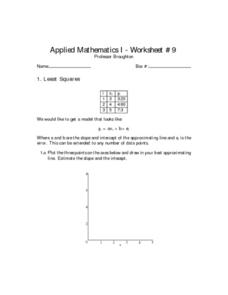
Least Squares
In this least squares worksheet, students solve 6 different problems that include the least squares of numbers. First, they plot 3 points on the axes shown and draw in their best approximating line. Then, students estimate the slope and...
Discovery Education
Discovering Math: Beginning Measurement
Weight, time, length, cost, and mass are all things we can measure. Learners are introduced to the concepts they'll need to know before embarking on any measurement adventure. They are introduced to each type of measurement and types of...
Curated OER
A Special Relationship
Learners discover the relationships of the lengths of the sides of right triangles and right triangles using a series of drawings on dot paper. They investigate and solve problems of standard (customary and metric units) and non-standard...
Curated OER
The Way to Better Grades!
Pupils collect and analyze data. In this statistics lesson, learners create a scatter plot from their collected data. They use, tables and graphs to analyze the data and mae decisions.
Curated OER
Everything Weather
Hurricanes are the very definition of exciting weather. Your 5th graders can follow this lesson and explore hurricanes with the help of Everything Weather software. They will locate information and answer questions about hurricanes. This...
Curated OER
Climate Shifts
Eight slides of information related to shifts in the climate make up this presentation. The vocabulary and concepts displayed are geared toward high school meteorology learners. Content is not cohesive from slide to slide, but the...
EngageNY
Advanced Factoring Strategies for Quadratic Expressions (part 2)
What do you do with a difficult-to-factor quadratic expression? This lesson provides the answer. Pupils learn a grouping strategy to help factor trinomials. When guess and check seems too tedious, this method is the "works every...
Curated OER
Biography: Telling Someone's Life Story
There are many different ways to help your students get excited about writing biographies.
Curated OER
Order of Operations
Ninth graders investigate the order of operations. In this Algebra I lesson, 9th graders explore the rules of arithmetic and algebra as they review and practice simplifying increasingly complex numeric expressions using the order...
Curated OER
How Texas is Planning To Manage Its Water
Learners research water management strategies in Texas. They analyze projected demand for water in the year 2050, interpret graphs and tables and then discuss the data as part of a written report. They research and map the locations of...
Curated OER
Graphing and the Coordinate Plane
Students examine the four quadrants of Cartesian coordinate plane. They play maze games and coordinate games to discover how to read and plot points on the plane. Students plot points on the coordinate plane and examine the ratio of...
Curated OER
Slope
Students calculate the slope of a line. In this slope lesson, students use a graph, an equation or two points to help them calculate the slope of a line. They differentiate between a slope of zero and an undefined slope.
Curated OER
Transformations and Exponential Functions
Tenth graders study graphing exponential functions. In this transformations instructional activity, 10th graders apply inquiry to determine how changes to a parent function affect its graph. Students analyze transformed graphs and...
Texas Instruments
Buying Your First New Car!
Learners explore exponential growth and decay using M&M’s in this Algebra II/Pre-calculus lesson. They investigate the cost of a new car by calculating depreciation and payments.


