Hi, what do you want to do?
Khan Academy
Khan Academy: Practice: Recognize Functions From Graphs
Answer this question to see if understand how to determine a function based on a graph.
Texas Instruments
Texas Instruments: Explore Graphs and Factors
Students use a graphing calculator to explore the relationship between the linear factors of a quadratic function and its zeros. They learn that the x-intercepts and axis of symmetry of a quadratic function can be determined from its...
Varsity Tutors
Varsity Tutors: Hotmath: Practice Problems: Functions and Their Graphs
Thirty-three problems present a variety of practice graphing a relation and checking to see if it is a function. They are given with each step to the solution cleverly revealed one at a time. You can work each step of the problem then...
Khan Academy
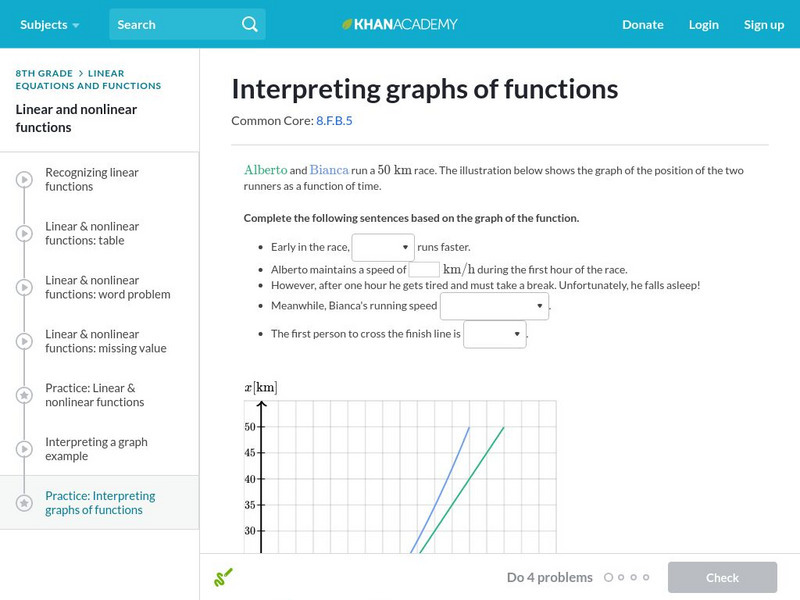
Khan Academy: Interpreting Graphs of Functions
Interpret the graphs of both linear and nonlinear functions. Students receive immediate feedback and have the opportunity to try questions repeatedly, watch a video, or receive hints.
Concord Consortium
Seeing Math: Linear Transformer
Transformations of linear functions, with links between the symbolic and graphic forms, can be powerful tools to help students overcome conceptual hurdles in algebra.
Common Core Sheets
Common Core Sheets: Functions 8.f.3 Worksheets
Print or create worksheets to assess students' understanding of linear functions.
Other
Algebra.com: Linear Equation and System Solvers
Linear equations can be solved and graphed using this interactive site. This site allows the user to enter any linear equation in standard form and the y-intercept will be found through a step-by-step process. Systems of inequalities can...
Texas Instruments
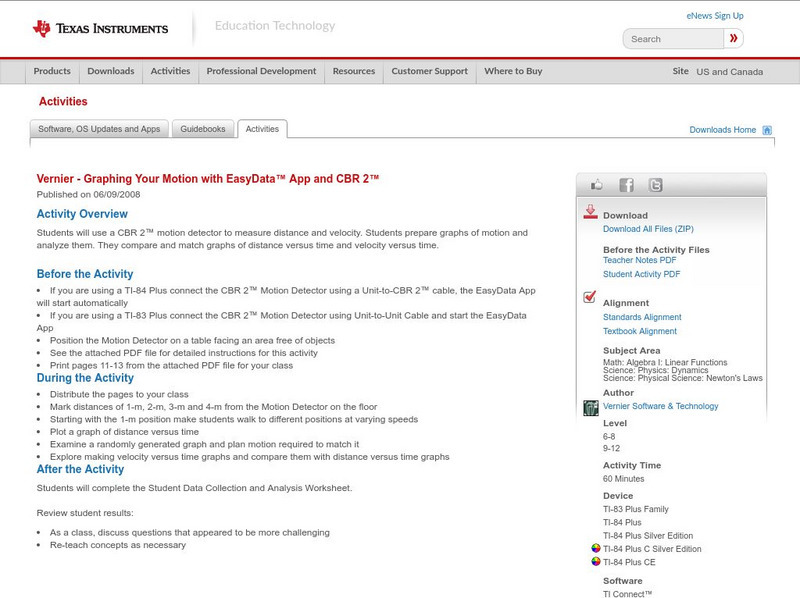
Texas Instruments: Graphing Your Motion With Easy Data App and Cbr 2
Students can use a CBR 2 motion detector to measure distance and velocity. Students prepare graphs of motion and analyze them. They compare and match graphs of distance versus time and velocity versus time.
Texas Instruments
Texas Instruments: Velocity Test: Interpreting Velocity Graphs
In this activity, students' will use a motion detector to record the distance versus time data for the simple motion of a walker. They will calculate velocity from this graph and compare it with the velocity graph generated by the...
Discovery Education
Discovery Education: Web Math: Graph a Line
WebMath offers a java applet that allows you to input the slope of a line and a point on the line and gives you the equation, in slope-intercept form, of the line with the given slope that passes through the point. It also includes a...
Texas Instruments
Texas Instruments: Linear Functions: Slope Intercept Form
Students learn to develop the equation of a line from its graph. They also learn to write the equation of a line from the slope and the y-intercept, a point and the slope, and two points. They also investigate slopes of lines that are...
Texas Instruments
Texas Instruments: Linear Functions: Slope as Rate of Change
Students learn to associate the slope of a straight line with a constant rate of change. They also learn to calculate the rate of change from data points on a line, using the correct units. Students also learn to read from a linear...
Math Planet
Math Planet: Algebra 2: Graph Inequalities
How to graph an inequality is explained through examples and a video lesson. [4:14]
Khan Academy
Khan Academy: Graphing Proportional Relationships
Students work with rates of change to graph proportional relationships. They receive immediate feedback and have the opportunity to try questions repeatedly, watch a video, or receive hints.
CK-12 Foundation
Ck 12: Algebra: Domain and Range of a Function
[Free Registration/Login may be required to access all resource tools.] Identify the domain and range of a simple linear function
CK-12 Foundation
Ck 12: Algebra: Graphs Using Slope Intercept Form
[Free Registration/Login may be required to access all resource tools.] Learn how to graph lines using slope-intercept form.
CK-12 Foundation
Ck 12: Algebra: Domain and Range of a Function
[Free Registration/Login may be required to access all resource tools.] Identify the domain and range of a simple linear function
Sophia Learning
Sophia: Graphing Using Intercepts Tutorial
Follow step by step instruction to solve for x and y-intercepts, plot points, and graph the linear function.
ClassFlow
Class Flow: Promethean Planet: Graphing and Interpreting Linear Functions
[Free Registration/Login Required] This flipchart shows students how to plot points on a coordinate plane, create linear graphs and translate linear functions between differing forms.
Texas Education Agency
Texas Gateway: Collecting Data and Making Predictions
Given an experimental situation, the student will write linear functions that provide a reasonable fit to data to estimate the solutions and make predictions.
CK-12 Foundation
Ck 12: Algebra: Applications of Linear Graphs
[Free Registration/Login may be required to access all resource tools.] In this lesson, students learn how to analyze linear graphs to solve problems. Students watch a video tutorial, explore guided notes and attempt practice problems.
CK-12 Foundation
Ck 12: Algebra: Graphs of Linear Models of Direct Variation
[Free Registration/Login may be required to access all resource tools.] Students will write, graph, and solve direct variation models for real-world problems. Students examine guided notes, review guided practice, study vocabulary, watch...
Texas Instruments
Texas Instruments: C Ds Anyone?
In this activity, students write rules for real world functions. They make a table to compare function values and graph linear functions on the coordinate plane.
Khan Academy
Khan Academy: Algebra I: Exponential vs. Linear Growth Over Time
Practice analyzing the end behavior of two functions that model similar real-world relationships, where one function is exponential and the other is polynomial. Students receive immediate feedback and have the opportunity to try...


