Hi, what do you want to do?
Texas Instruments
Texas Instruments: Getting Started With the Ti Navigator: If the Line Fits
This lesson introduces students to Activity Center and introduces students to the use of symbolic algebra to represent real world situations. They will use Activity Center to contribute equations that model a linear relationship and then...
Texas Instruments
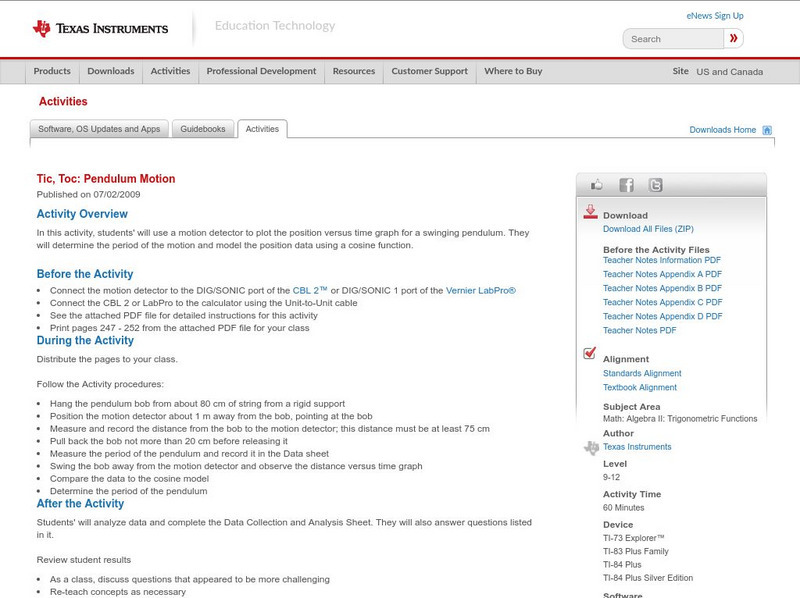
Texas Instruments: Tic, Toc: Pendulum Motion
In this activity, students' will use a motion detector to plot the position versus time graph for a swinging pendulum. They will determine the period of the motion and model the position data using a cosine function.
Illustrative Mathematics
Illustrative Mathematics: F Le Boiling Water
Students are shown two tables of data showing the approximate boiling point of water at different elevations. Both data sets can be modeled by linear functions but with different slopes. When the tables are combined, however, students...
Illustrative Mathematics
Illustrative Mathematics: F Le Choosing an Appropriate Growth Model
The goal of this task is to examine some population data for large cities from a modeling perspective. Students are asked to decide if the population data can be accurately modeled by a linear, quadratic, and/or exponential function, and...
CK-12 Foundation
Ck 12: Algebra: Applications of Function Models
[Free Registration/Login may be required to access all resource tools.] In this lesson students draw a scatter plot of data, find and draw the function that best fits that data, and make predictions from that information. Students watch...
Illustrative Mathematics
Illustrative Mathematics: F le.a & N Rn Extending the Definitions of Exponents 2
A biology student is studying bacterial growth. She was surprised to find that the population of the bacteria doubled every hour. Aligns with the F-LE.A and N-RN.A.1 standards.
Richland Community College
Richland Community College: Math 116 Lecture Notes
This site from the Richland Community College provides the detailed lecture notes to a college algebra course, complete with equations and definitions. Content ranges from "functions and their graphs" to "conics and parametric equations."
Illustrative Mathematics
Illustrative Mathematics: S Id, F if Laptop Battery Charge
This task uses a situation that is familiar to students to solve a problem they probably have all encountered before: How long will it take until an electronic device has a fully charged battery? Given data, students perform a variety of...
Texas Instruments
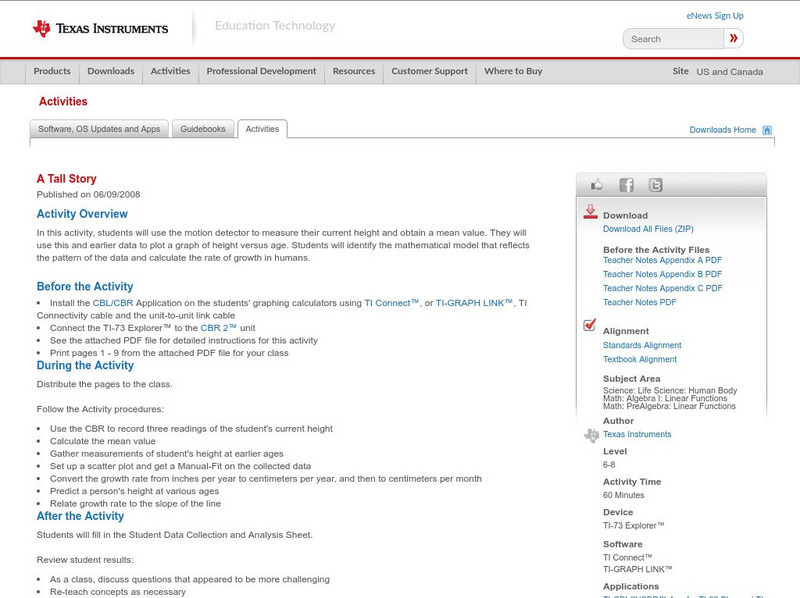
Texas Instruments: A Tall Story
In this activity, students can use the motion detector to measure their current height and obtain a mean value. They will use this and earlier data to plot a graph of height versus age. Students will identify the mathematical model that...
Math Graphs
Houghton Mifflin: Math Graphs: Fitting Models to Scatter Plots 1 [Pdf]
Students use a scatter plot to determine whether data can be modeled by a linear function, a quadratic function, a trigonometric function, or that there appears to be no relationship between x and y. The resource consists of an enlarged...
Math Graphs
Houghton Mifflin: Math Graphs: Fitting Models to Scatter Plots 2 [Pdf]
Students use a scatter plot to determine whether data can be modeled by a linear function, a quadratic function, a trigonometric function, or that there appears to be no relationship between x and y. The resource consists of an enlarged...
Math Graphs
Houghton Mifflin: Math Graphs: Fitting Models to Scatter Plots 3 [Pdf]
Students use a scatter plot to determine whether data can be modeled by a linear function, a quadratic function, a trigonometric function, or that there appears to be no relationship between x and y. The resource consists of an enlarged...
Math Graphs
Houghton Mifflin: Math Graphs: Fitting Models to Scatter Plots 4 [Pdf]
Students use a scatter plot to determine whether data can be modeled by a linear function, a quadratic function, a trigonometric function, or that there appears to be no relationship between x and y. The resource consists of an enlarged...
Texas Instruments
Texas Instruments: Exponential Models and Logarithmic Scales
In this activity, students will analyze exponential growth data and then switch to a logarithmic scale. Includes both an exponential and a linear regression on the data, and asks students to make connections between two forms of...
Texas Instruments
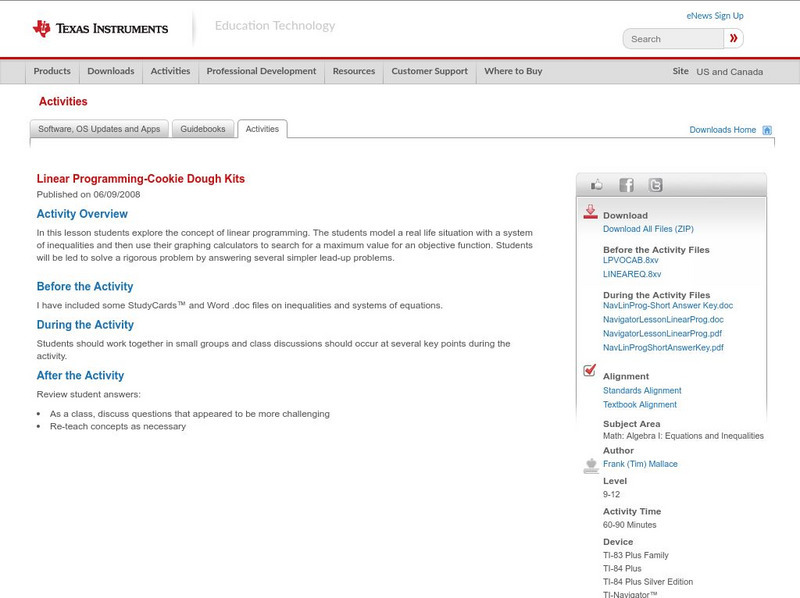
Texas Instruments: Linear Programming Cookie Dough Kits
In this lesson students explore the concept of linear programming. The students model a real life situation with a system of inequalities and then use their graphing calculators to search for a maximum value for an objective function....
Texas Instruments
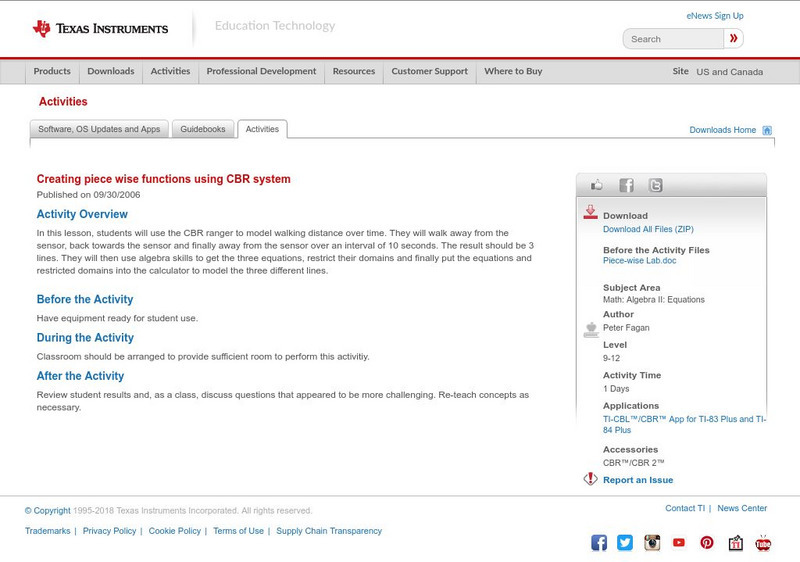
Texas Instruments: Creating Piece Wise Functions Using Cbr System
In this lesson, students can use the CBR ranger to model walking distance over time. They will walk away from the sensor, back towards the sensor and finally away from the sensor over an interval of 10 seconds. The result should be 3...
Student Achievement Partners
Student Achievement Partners: Penny Circle Task [Pdf]
Students will explpre models and understand the difference between quadratic, exponential, and linear models in this activity.
Missouri State University
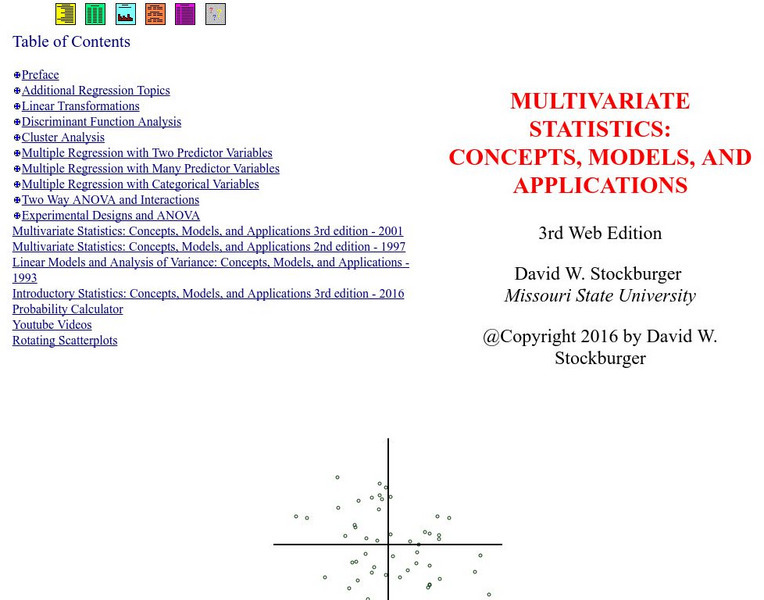
Missouri State U.: Multivariate Statistics: Concepts, Models, and Applications
This site features an online textbook with very in-depth information about multivariable statistics. (NOTE: In the archived version, some images do not appear. However, many of them are multiple-choice questions for students, and if you...
Khan Academy
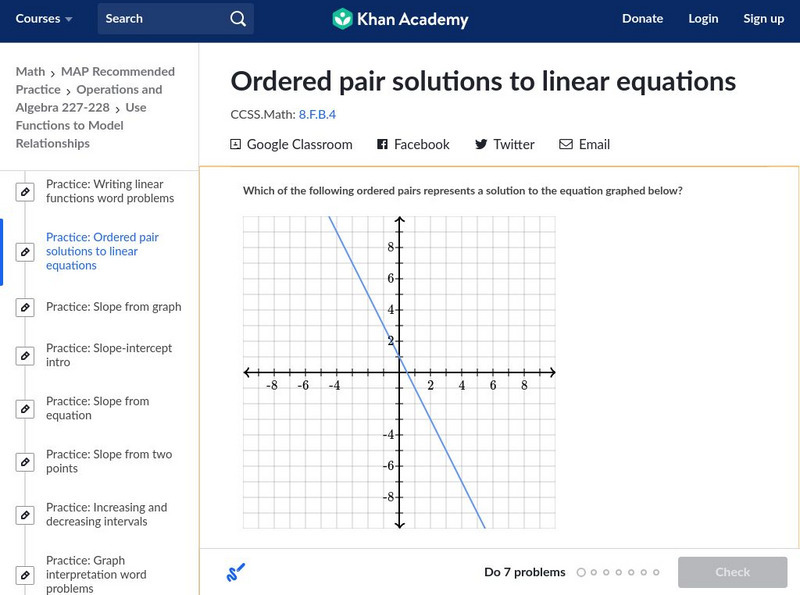
Khan Academy: Ordered Pair Solutions to Linear Equations
Determine which ordered pair represents a solution to a graph or equation. Students receive immediate feedback and have the opportunity to try questions repeatedly, watch a video or receive hints.
Texas Instruments
Texas Instruments: Math Today for Ti Navigator System Humidity Makes Air Feel
Using data from the USA TODAY graphic "Humidity makes air feel hotter" students will explore linear functions to determine how well they model the relationship between air temperature and heat index. When the model has been determined...
Khan Academy
Khan: Lsn 8: Interpreting Relationships in Scatterplots/graphs/tables/equations
This instructional activity focuses on Interpreting and analyzing linear, quadratic, and exponential models and graphs. Students will use best fit lines to interpret contexts, distinguish whether contexts are linear or exponential...
Khan Academy
Khan Academy: Fitting Quadratic and Exponential Functions to Scatter Plots
Determine if a quadratic or exponential model fits a data set better, then use the model to make a prediction. Students receive immediate feedback and have the opportunity to try questions repeatedly, watch a video or receive hints.
Illustrative Mathematics
Illustrative Mathematics: S Id.6a,7 Olympic Men's 100 Meter Dash
This task asks students to identify when two quantitative variables show evidence of a linear association and to describe the strength and direction of that association. Students will use a scatterplot showing the finishing times for the...
CK-12 Foundation
Ck 12: Algebra: Logarithms
[Free Registration/Login may be required to access all resource tools.] This lesson defines and shows you how to use logarithms.







![Houghton Mifflin: Math Graphs: Fitting Models to Scatter Plots 1 [Pdf] Unknown Type Houghton Mifflin: Math Graphs: Fitting Models to Scatter Plots 1 [Pdf] Unknown Type](https://static.lp.lexp.cloud/images/attachment_defaults/resource/large/FPO-knovation.png)

