Hi, what do you want to do?
Texas Instruments
Texas Instruments: Tight Rope
In this activity, students examine quantities that are linearly related and can be visually represented using a straight-line graph. Students collect distance versus time data using a motion detector and find a model for the...
Texas Instruments
Texas Instruments: Getting Started With the Ti Navigator: Exploring Change
This activity introduces students to Activity Center. In this activity, students will explore change in the context of cellular telephone charges. Students will create a scatter plot showing that the rate per minute for a "pay as you go"...
Texas Instruments
Texas Instruments: Warming Up to Heating Curves
In this activity, students use the CBL 2 to collect temperature data as a sensor warms up in a cup of water. They find an appropriate mathematical model for the resulting data set.
Texas Instruments
Texas Instruments: Mc Dougal Littell Algebra 1: Find Minimum and Maximum
Students can use the TI-84 Plus family to find the minimum or maximum and the zeros of quadratic functions.
Texas Instruments
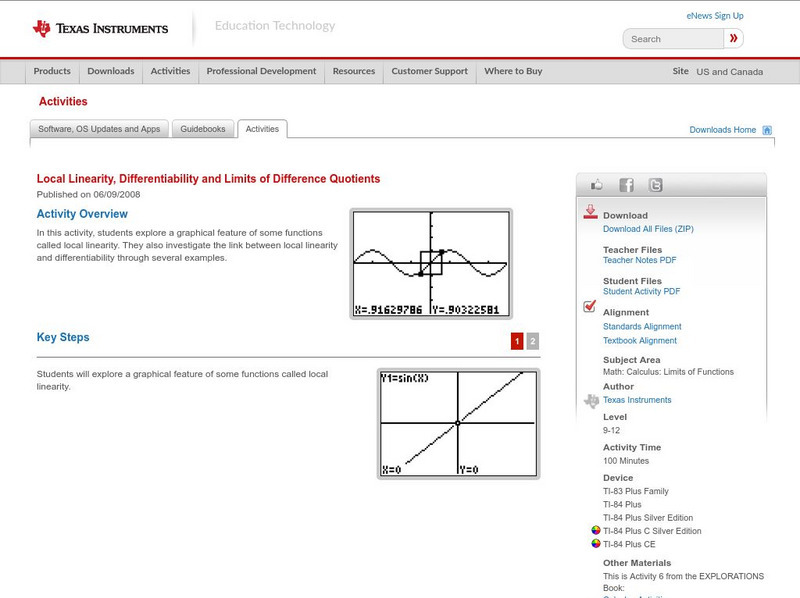
Texas Instruments: Local Linearity and Differentiability
In this activity, students explore a graphical feature of some functions called local linearity. They also investigate the link between local linearity and differentiability through several examples.
Texas Instruments
Texas Instruments: Velocity Test: Interpreting Velocity Graphs
In this activity, students' will use a motion detector to record the distance versus time data for the simple motion of a walker. They will calculate velocity from this graph and compare it with the velocity graph generated by the...
Texas Instruments
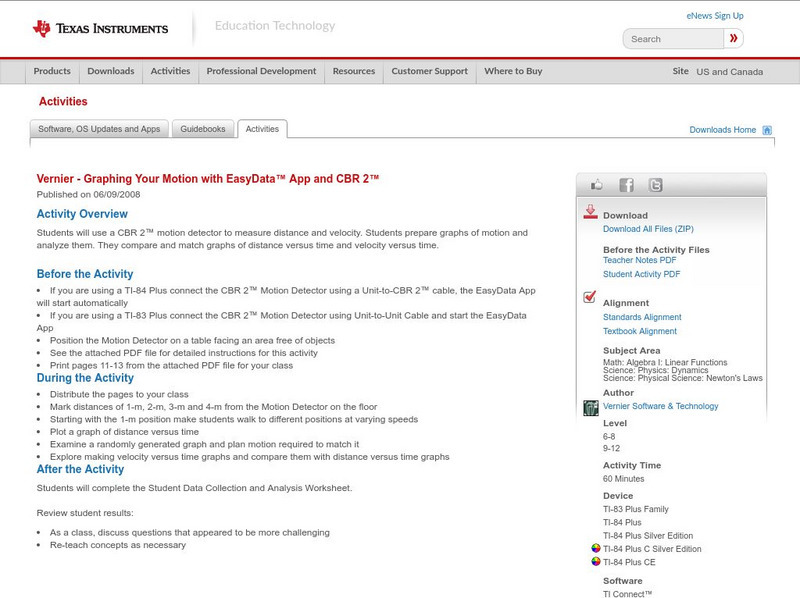
Texas Instruments: Graphing Your Motion With Easy Data App and Cbr 2
Students can use a CBR 2 motion detector to measure distance and velocity. Students prepare graphs of motion and analyze them. They compare and match graphs of distance versus time and velocity versus time.
Texas Instruments
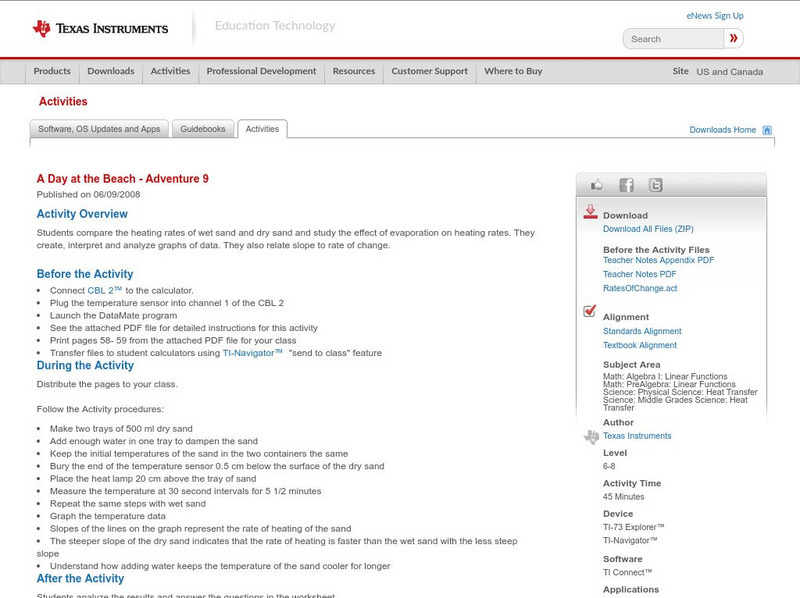
Texas Instruments: A Day at the Beach Adventure 9
Students compare the heating rates of wet sand and dry sand and study the effect of evaporation on heating rates. They create, interpret and analyze graphs of data. They also relate slope to rate of change.
Texas Instruments
Texas Instruments: A Sweet Drink Adventure 7
Students determine how the temperature of water affects the dissolving time of a sugar cube. They create, interpret and analyze graphs of data, find an equation of the line of best fit, and relate slope to rate of change.
Texas Instruments
Texas Instruments: Ti 73 and Cbl in Data Collection
Using the TI 73 and CBL to collect samples of water for temp, pH, etc connecting math and science curriculums in the middle school.
Texas Instruments
Texas Instruments: Use the Regression Feature to Find a Line of Best Fit
This tutorial shows you how to enter a set of data and find the line of best fit.
Texas Instruments
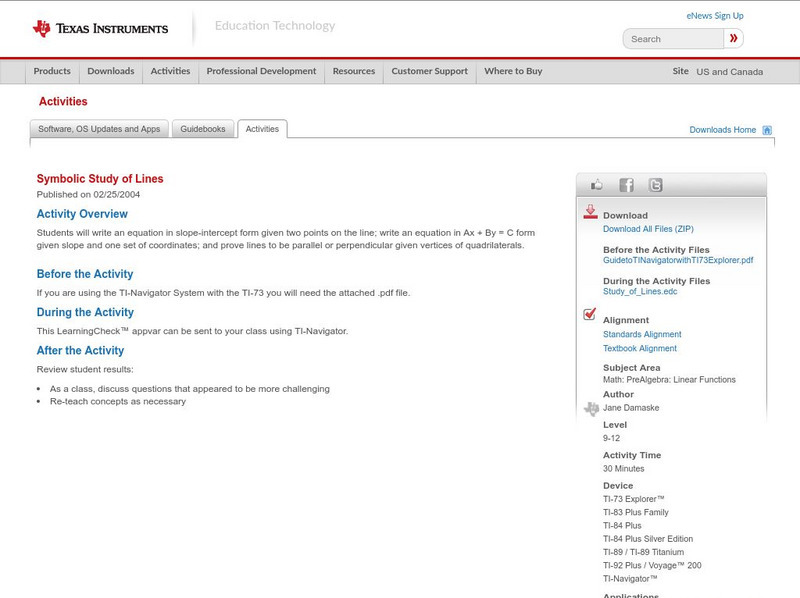
Texas Instruments: Symbolic Study of Lines
Students will write an equation in slope-intercept form given two points on the line; write an equation in Ax + By = C form given slope and one set of coordinates; and prove lines to be parallel or perpendicular given vertices of...
Texas Instruments
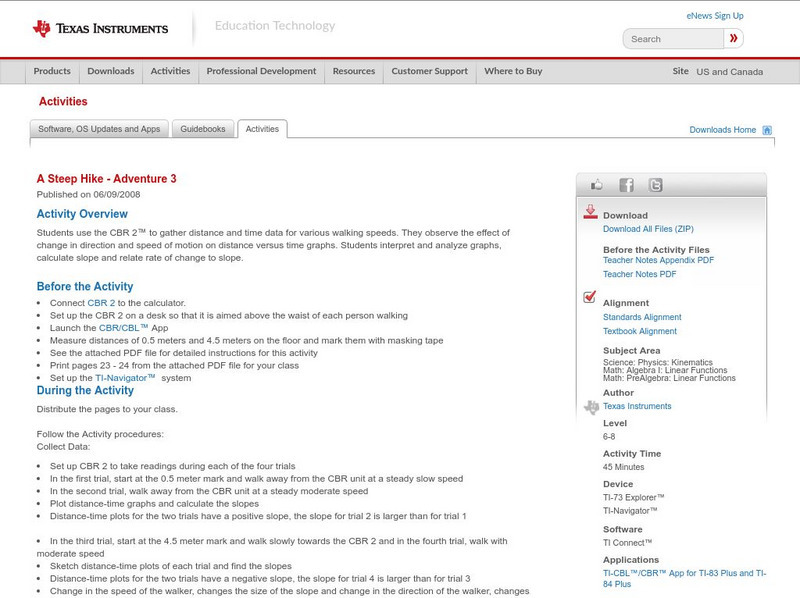
Texas Instruments: A Steep Hike Adventure 3
Students use the CBR 2 to gather distance and time data for various walking speeds. They observe the effect of change in direction and speed of motion on distance versus time graphs. Students interpret and analyze graphs, calculate slope...
Texas Instruments
Texas Instruments: A Wet Welcome Home Adventure 4
Students perform an experiment that simulates a leaking pipe and gather data on volume of water lost over time. They graph the data collected as a scatter plot, find the equation of the line of best fit, find the total volume of water...
Ministry of Education and Universities of the Region of Murcia (Spain)
Ministerio De Educacion Y Ciencia: Funciones Elementales
This is an interactive activity to recognize a liner, quadratic or radical function by its algebraic expression or by its graph.
Shodor Education Foundation
Shodor Interactivate: Lesson: Arithmetic Practice W/ Ordered Pairs
The Shodor Education Foundation provides this lesson plan to have students practice simple computation that results in them graphing their answers. If they are accurate they will have a straight line. Students use an interactive...
University of South Florida
Fcat: Exploring Linear Equations: Teacher Notes
This lesson plan guides students through the use of a graphing calculator to explore the slope and y-intercept of a line.
Texas Instruments
Texas Instruments: Creating Piece Wise Functions Using Cbr System
In this lesson, students can use the CBR ranger to model walking distance over time. They will walk away from the sensor, back towards the sensor and finally away from the sensor over an interval of 10 seconds. The result should be 3...
Other
Desmos: Modeling Bundle
A collection of activities where students investigate mathematical modeling. Activities involve different types of functions, how to examine context and decide on a model, and limitations.
Texas Instruments
Texas Instruments: The Shrinking Dollar
In this activity, students examine the long term effects of inflation. They compute the increase in cost price due to compounding of inflation rates every year. They recognize that this increase in cost price is exponential.
Texas Instruments
Texas Instruments: Getting Started With the Ti Navigator: Picks Theorem
This lesson introduces students to Activity Center and is intended to help students interpret representations of functions of two variables. The Activity Center will be used to investigate equations that represent a company's income,...
Texas Instruments
Texas Instruments: What's My Line?
This activity focuses on strengthening student understanding of connections among graphical, tabular, and algebraic representations of simple linear functions. They enter a simple program that allows them to determine the equations for...
Texas Instruments
Texas Instruments: Social Security Issues
In this activity, you will look at the relationship between the age at which you start drawing social security and the amount drawn. Both graphs and spreadsheets will be used.
Texas Instruments
Texas Instruments: Getting Started With Ti Navigator: Compound Interest
This lesson introduces students' to Activity Center. In this lesson, students will explore the effect of compound interest on the amount of an investment over time. Students will work in small groups (or individually) to calculate...


