Curated OER
Estimating the Mile Record
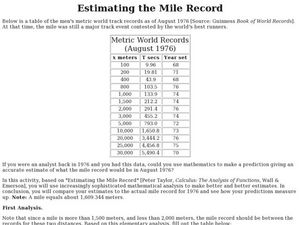
In this estimating the mile record, students examine given data. They use create a box-and-whisker plot to determine the upper and lower quartiles of the data. This one-page worksheet contains 1 multi-step problems.
Curated OER
What are the Odds
Students predict the-outcome of an event. In this algebra lesson, students compare and contrast the probability of an event occurring. They calculate the odds of a simple event and make estimation.
Curated OER
La Toteca- A Tropical Paradise
Students collect data on the time of the ferry. For this algebra lesson, students use the data to predict a ferry schedule. They also compute the depth where oxygen would be needed when diving.
Curated OER
Exploring Centers of Triangles
Students explore properties of triangles using angle bisectors, incenters, circles, midpoints, and altitudes. They use Geometer's Sketchpad in order to create triangles and their properties.
Curated OER
The Topsy-Turvy Twins
Fourth graders read the problem and brainstorm for ways to solve the problem - list these on the board for the students to refer to as they solve the problem. They work in pairs and focus on the strategy selected.
Curated OER
Looking For Triangles
Students solve problems with triangles. In this geometry instructional activity, students analyze shapes to find different triangles. They name the shapes created by putting triangles together.
Curated OER
Confusing Colors!
Fourth graders collect data, graph their data, and then make predictions based upon their findings. They's interest is maintained by the interesting way the data is collected. The data collection experiment is from the psychology work of...


