Texas Education Agency
Texas Gateway: Determining the Domain and Range for Linear Functions
Given a real-world situation that can be modeled by a linear function or a graph of a linear function, the student will determine and represent the reasonable domain and range of the linear function using inequalities.
Illustrative Mathematics
Illustrative Mathematics: F Le Do Two Points Determine a Linear Function Ii?
In this task, students investigate the relationship between linear equations and linear functions. Aligns with F-LE.A.2.
Texas Education Agency
Texas Gateway: Determining Parent Functions (Verbal/graph)
Given a graph or verbal description of a function, the student will determine whether the parent function is quadratic or linear.
Shodor Education Foundation
Shodor Interactivate: Functional Graphs
Students will graph input/output pairs from a simple linear function in order to gain an understanding of basic linear functions.
Illustrative Mathematics
Illustrative Mathematics: 8.f Modeling With a Linear Function
In this task, 8th graders are presented with the equation for a linear function and asked to identify which of six problem situations the equation could represent. Aligns with 8.F.B.
Texas Education Agency
Texas Gateway:analyzing Effects of the Changes in M and B on the Graph of Y=mx+b
Given algebraic, graphical, or verbal representations of linear functions, the studnet will determine the effects on the graph of the parent function f(x) = x.
Cuemath
Cuemath: Constant Functions
This mini-lesson targets the concept of constant functions. Provides a definition, shows graphs, and defines their characteristics along with some solved examples and a few practice questions to test your understanding.
Illustrative Mathematics
Illustrative Mathematics: F Le Exponential Growth Versus Linear Growth Ii
In this task, students compare exponential and linear functions and find that exponential functions with a base larger than one eventually exceed in value any given linear (or polynomial) function if the value of the input is...
Math Planet
Math Planet: Algebra 1: Linear Equations in the Coordinate Plane
Provides examples and a video lesson that illustrates how to graph a linear equation.
Illustrative Mathematics
Illustrative Mathematics: F Bf Temperatures in Degrees Fahrenheit and Celsius
In this task involving temperature conversions, students construct a linear function given two input-output pairs, investigate the inverse of a linear function, and reason about quantities and/or solving a linear equation. Aligns with...
Illustrative Mathematics
Illustrative Mathematics: F Le Us Population 1982 1988
In this task, students are shown a table of U.S. population data between 1982 and 1988 and are asked to explore whether linear functions would be appropriate to model relationships within the data. Aligns with F-LE.B.5 and F-LE.A.1.b.
Illustrative Mathematics
Illustrative Mathematics: F Le Equal Differences Over Equal Intervals 1
In this task, learners prove that linear functions grow by equal differences over equal intervals, and notice that in this case, the equal differences have the same value as the slope. Aligns with F-LE.A.1.a.
Illustrative Mathematics
Illustrative Mathematics: F Le Exponential Growth Versus Linear Growth I
In this task, students analyze two methods of payment to discover how an exponentially increasing quantity eventually surpasses a linearly increasing quantity. Aligns with F-LE.A.3.
Shodor Education Foundation
Shodor Interactivate: Function Flyer
This activity allows the manipulation of the constants and coefficients in any function thereby encouraging the user to explore the effects on the graph of the function by changing those numbers.
Illustrative Mathematics
Illustrative Mathematics: F Le Boiling Water
Students are shown two tables of data showing the approximate boiling point of water at different elevations. Both data sets can be modeled by linear functions but with different slopes. When the tables are combined, however, students...
Illustrative Mathematics
Illustrative Mathematics: F if Oakland Coliseum
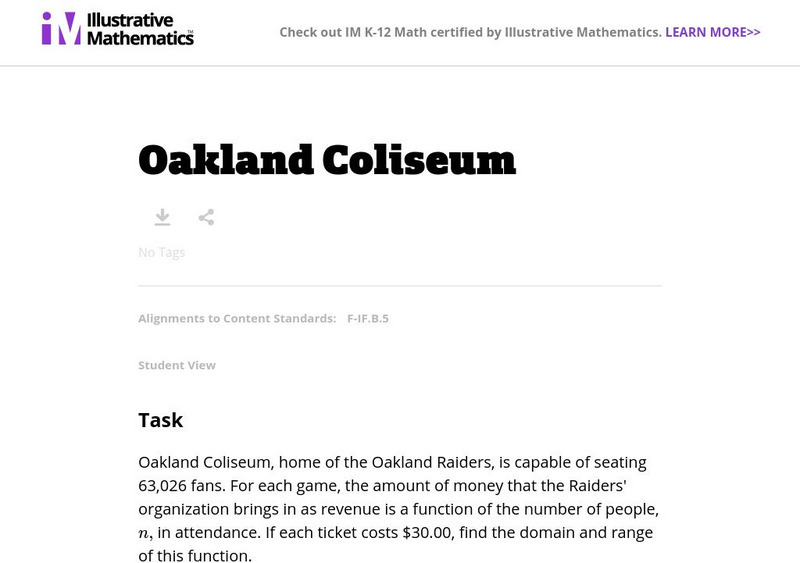
In this task, students are asked to find the domain and range of a linear function in the context of ticket sales at the Oakland Coliseum. Aligns with F-IF.B.5.
Texas Instruments
Texas Instruments: Explore Graphs and Factors
Students use a graphing calculator to explore the relationship between the linear factors of a quadratic function and its zeros. They learn that the x-intercepts and axis of symmetry of a quadratic function can be determined from its...
Other
Asl: Heart of Algebra: Chapters 19 21 (Sat and Psat Prep)
Chapter 19 Heart of Algebra focuses on the mastery of linear equations, systems of linear equations, and linear functions. The ability to analyze and create linear equations, inequalities, and functions is essential for success in...
Illustrative Mathematics
Illustrative Mathematics: 8.f Delivering the Mail, Assessment Variation
This task assesses a student's ability to construct a linear function and interpret its parameters within the context of a mail truck's mileage. Aligns with 8.F.B.4.
Math Planet
Math Planet: Pre Algebra: Graphing Linear Inequalities
Discover how to graph linear inequalities by taking a look at an example and a video lesson.
Illustrative Mathematics
Illustrative Mathematics: G Gpe.5 Triangles Inscribed in Circle
In this task, students use ideas about linear functions to determine when certain angles are right angles. They use the fact that two lines (if not vertical or horizontal) are perpendicular when their slopes are inverse reciprocals, as...
Illustrative Mathematics
Illustrative Mathematics: F Le, a Rei Population and Food Supply
In this task, learners analyze the sizes of a country's population and of its food supply to determine when and if food shortages will occur. To solve it, they must construct and compare linear and exponential functions and find where...
Illustrative Mathematics
Illustrative Mathematics: F Bf.3 Transforming the Graph of a Function
This task examines, in a graphical setting, the impact of adding a scalar, multiplying by a scalar, and making a linear substitution of variables on the graph of a function f. There is no formula for the function so the focus is on...
Illustrative Mathematics
Illustrative Mathematics: S Id, F if Laptop Battery Charge
This task uses a situation that is familiar to students to solve a problem they probably have all encountered before: How long will it take until an electronic device has a fully charged battery? Given data, students perform a variety of...
Other popular searches
- Graphing Linear Functions
- Linear Function Tables
- Linear Functions and Graphs
- Writing Linear Functions
- Graph Linear Function
- Nonlinear Functions
- Inverse Linear Functions
- Linear Function Rules
- Graphs of Linear Functions
- Linear Function Models
- Linear Function Game
- Nonlinear Equations
