Texas Instruments
Texas Instruments: Exploring Linear Equations
This activity uses the Transformation Graphing Application to explore the linear equation after entering data into lists and doing a statistical plot of the data.
McGraw Hill
Glencoe Mathematics: Online Study Tools: Quiz on Writing Linear Equations
Learners demonstrate comprehension of advanced mathematical concepts in Algebra II. The questions check understanding on writing linear equations. Topics include modeling real-world data with linear equations, slope-intercept form, and...
TeachEngineering
Teach Engineering: Linear Regression of Bmd Scanners
Students complete an exercise showing logarithmic relationships and examine how to find the linear regression of data that does not seem linear upon initial examination. They relate number of BMD scanners to time.
Texas Instruments
Texas Instruments: Solving a System of Linear Equations
In this activity, students' will collect and analyze motion data in order to determine the solution to a linear system of equations. They graph two motions on a common axis and find their intersection.
Texas Instruments
Texas Instruments: Fitting an Equation to Bivariate Data
In this activity, students fit a linear least-square regression line to population data. They explore various functions to model the given data.
Texas Instruments
Texas Instruments: Finding Linear Models
Students graph a scatter plot, find average rate of change, develop a linear model, find a linear regression and a median/median line for a set of data graphed in a scatter plot and predict profit.
Texas Instruments
Texas Instruments: The Linear Force Relation for a Rubber Band
In this activity, students' will use a force sensor and a motion detector to study the relationship between the force applied to a rubber band and the distance to which it stretches. They will then model force versus strech data with a...
University of South Florida
Fcat: Shaq's Hand/foot Span: Teacher Notes
Learners compare their own hand/foot span to Shaquille O'Neal's, then graph the data & construct a best-fit line. They can then use the information to investigate the proportionality of the human body.
ClassFlow
Class Flow: Fitting Models to Data
[Free Registration/Login Required] A basic premise of science is that much of the physical world can be described mathematically and many physical phenomena are predictable. This scientific outlook took place in Europe during the late...
Texas Instruments
Texas Instruments: Linear Relationship Between Weight and Quality
Students use a Force Sensor to collect weight versus number data for a collection of identical pennies and model the data using a linear equation. They will then interpret the slope as it relates to independent and dependent variables.
University of South Florida
Florida Center for Instructional Tech: Famous People
Students estimate the ages of famous people, then create a scatterplot with the actual ages. This activity allows them to estimate with linear equations. You can access the age data through the "activity" link.
Texas Instruments
Texas Instruments: Ball Toss Activity
Students receive data from tossing a ball into the air. They are to graph it, set a window, and analyze the height, how long it was in the air, etc. They then find an equation that models the data.
Texas Instruments
Texas Instruments: Graphing Your Motion With Easy Data App and Cbr 2
Students can use a CBR 2 motion detector to measure distance and velocity. Students prepare graphs of motion and analyze them. They compare and match graphs of distance versus time and velocity versus time.
Texas Instruments
Texas Instruments: An Exploration of Direct Variation and Linear Regression
Students will use this activity for the following Algebra concepts: Review of Direct Variation; Properties of direct variations; Finding the constant of variations from data sets; Find missing values in data sets both numerically and...
Texas Instruments
Texas Instruments: What Is a Linear Regression?
In this activity, students create lists of data points, plot them on a graph, and determine the regression equation of the best fitting line. They also understand exactly how the linear regression is determined.
Texas Instruments
Texas Instruments: Step by Step Activity Data Collection & Analysis
In this activity, students create a situation that produces linear behavior by stepping heel to toe and taking distance readings as each step is taken. Students then apply the properties of a linear function to develop a model for motion.
Texas Instruments
Texas Instruments: Exploring the Golden Arches
Using given nutritional information of popular items from McDonald's, the students will develop and test a conjecture based on the given information. The students will analyze the two-variable data using the graphics calculator by...
Texas Instruments
Texas Instruments: Inverse of Two Temps
In this activity, students find a conversion equation that will calculate the corresponding Celsius temperature for any given Fahrenheit temperature. Students learn to graph scatter plots, analyze and graph linear equations, compute and...
Texas Instruments
Texas Instruments: Chill Out: How Hot Objects Cool
Students use a temperature probe to collect data as the warmed probe cools. Students investigate Newton's law of cooling and model cooling data with an exponential function. They fit the data to a mathematical model after analysis.
Texas Instruments
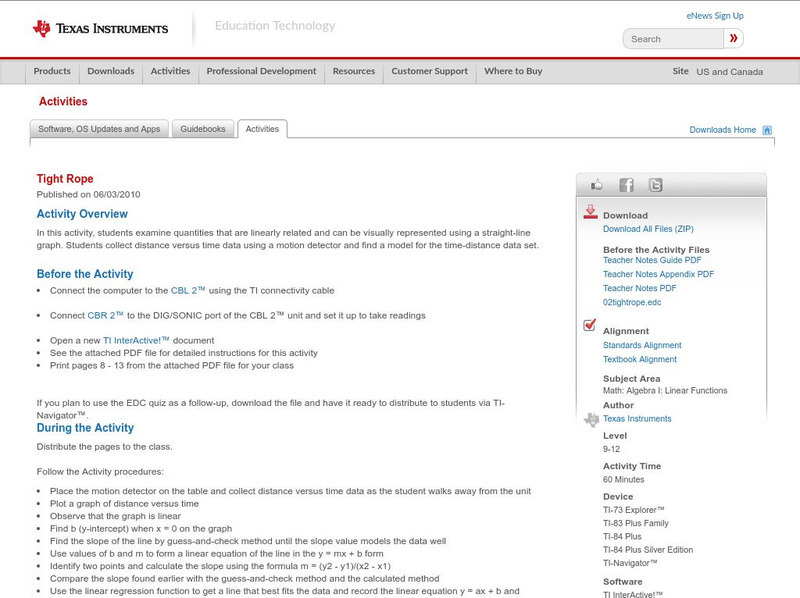
Texas Instruments: Tight Rope
In this activity, students examine quantities that are linearly related and can be visually represented using a straight-line graph. Students collect distance versus time data using a motion detector and find a model for the...
Texas Instruments
Texas Instruments: Stepping to the Greatest Integer: Greatest Integer Function
In this activity, students' will use a motion detector to collect position data showing evenly-spaced jumps in value. They will then model this data using the greatest integer function.
Texas Instruments
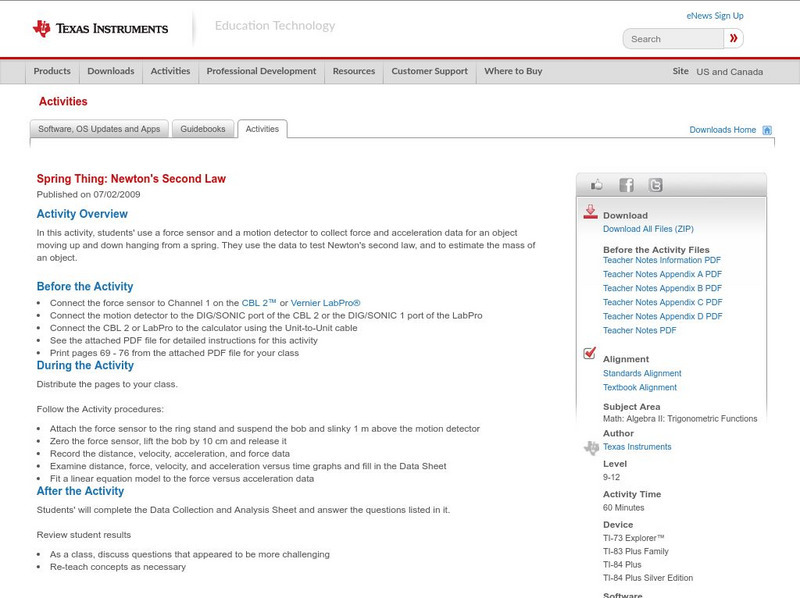
Texas Instruments: Spring Thing: Newton's Second Law
In this activity, students' use a force sensor and a motion detector to collect force and acceleration data for an object moving up and down hanging from a spring. They use the data to test Newton's second law, and to estimate the mass...
Texas Instruments
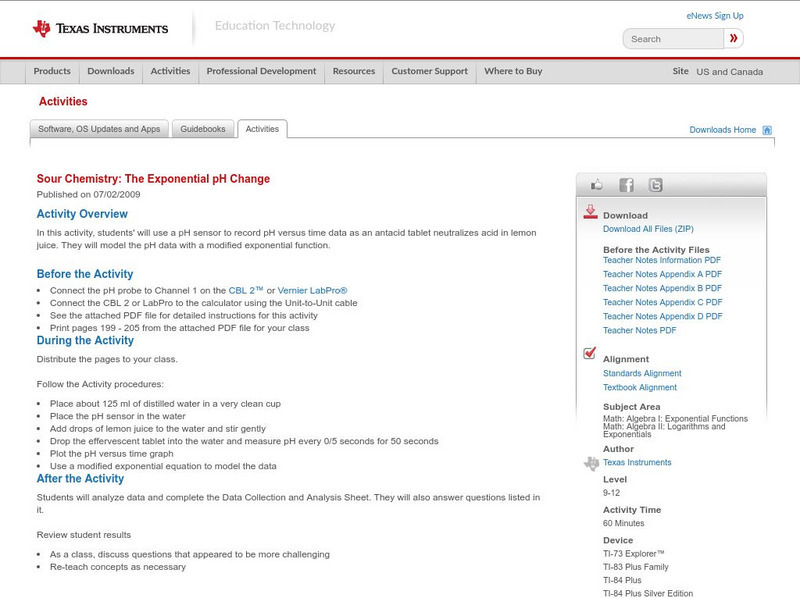
Texas Instruments: Sour Chemistry: The Exponential P H Change
In this activity, students' will use a pH sensor to record pH versus time data as an antacid tablet neutralizes acid in lemon juice. They will model the pH data with a modified exponential function.
Texas Instruments
Texas Instruments: Warming Up to Heating Curves
In this activity, students use the CBL 2 to collect temperature data as a sensor warms up in a cup of water. They find an appropriate mathematical model for the resulting data set.


