Texas Instruments
Texas Instruments: Identifying Types of Correlation From a Graph and Calculator
Students will identify different types of correlations graphically and by using the linear regression analysis obtained from a TI-84 Plus calculator. Students will also obtain and know the significance of a correlation coefficient as a...
Thinkport Education
Thinkport: Algebra Ii: Linear, Quadratic and Exponential Regression
Review linear regression and analyze how well this model fits the data. You will also be introduced to residuals and the correlation coefficient, and use these tools to determine whether or not a linear model is the best fit for a set of...
National Council of Teachers of Mathematics
Nctm: Illuminations: Linear Regression 1
An interactive program where students will explore regression lines. Students will be introduced to the correlation coefficient and come to understand what it represents through the given exploration. Requires Java.
Shodor Education Foundation
Shodor Interactivate: Multiple Linear Regression
Students compare multiple independent variables as predictors of one dependent variable. Students explore correlation and lines of best-fit.
Texas Instruments
Texas Instruments: Bivariate Data
This set contains statistics questions regarding bivariate data: scatter plots, the least-squares regression line, and their interpretation. The student is asked about the meaning of the various strengths and directions of linear...
National Institute of Standards and Technology (NIST)
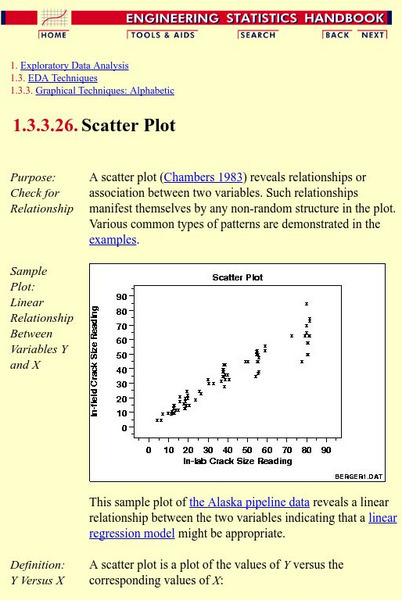
Nist: Engineering Statistics Handbook: Scatter Plots and Linear Regression
An explanation of scatter plots followed by examples of the many different kinds of scatter plots.
Khan Academy
Khan Academy: Correlation Coefficient Review
The correlation coefficient r measures the direction and strength of a linear relationship. Calculating r is pretty complex, so we usually rely on technology for the computations. We focus on understanding what r says about a scatterplot.
CK-12 Foundation
Ck 12: Statistics: Inferences About Regression
[Free Registration/Login may be required to access all resource tools.] This Concept introduces students to testing a claim about linear regression.
CK-12 Foundation
Ck 12: Statistics: Linear Regression Equations
[Free Registration/Login may be required to access all resource tools.] Use a calculator to create a scatter plot and to determine the equation of the line of best fit.
Other
Correlation Coefficients
This page provides a good discussion of correlation coefficients (r,) which indicate the "strength of the linear association between variables." Includes formulas and scatter plots. Some prior knowledge of statistics might be helpful.
University of Glasgow
University of Glasgow: Steps Statistics Glossary: Correlation Coefficient
Overview of correlation coefficient, or a number between 1 and -1 which measures the degree to which two variables are linearly related. It is followed by a description of the Pearson product moment correlation coefficient.
McGraw Hill
Glencoe Mathematics: Online Study Tools: Self Check Quiz on Linear Equations
The online assessment displays knowledge of concepts used in Algebra I. The multiple choice questions test learners on analyzing linear equations. Topics include calculating the equation of a line and interpreting correlation.
Math Is Fun
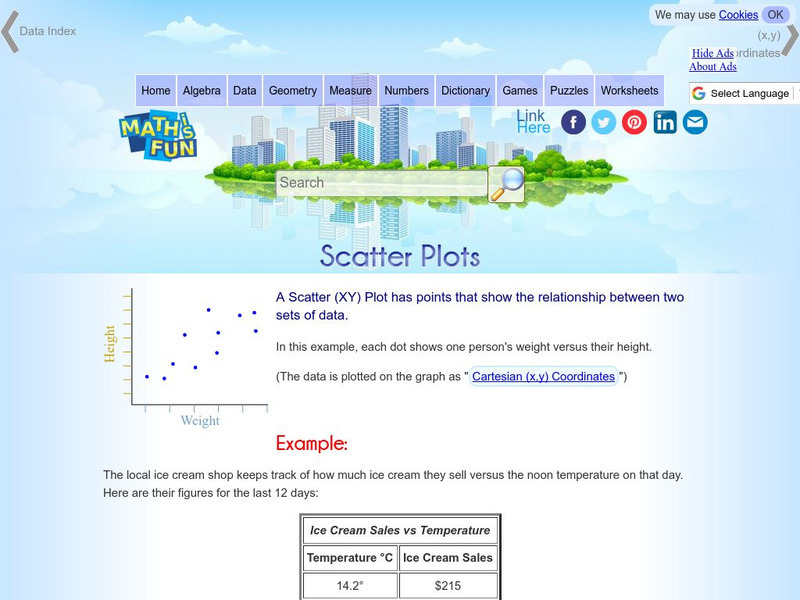
Math Is Fun: Scatter Plots
Explains, with examples, what scatter plots are and how to interpret the data. Discusses trends, interpolation and extrapolation, and correlation. Includes a set of practice questions.
Texas Instruments
Texas Instruments: Da Vinci's Proportions
This activity is designed to help students work with linear regression models, error, correlation coefficients and coefficients of determination. In this activity students not only deal with the mathematical concepts of regression but...
Texas Instruments
Texas Instruments: Work vs. Leisure
Students can use lists of data and the correlation factor of various regressions to determine the best regression line.
Texas Instruments
Texas Instruments: Trends in Data
A CSI activity that deals with "TRENDS IN DATA". You'll conduct an investigation whereby you'll measure parts of your body and contribute to the investigation data to solve a murder. You'll look at different relationships to find proper...
Ministry of Education and Universities of the Region of Murcia (Spain)
Ministerio De Educacion Y Ciencia: Variable Estadisticas Bidimensionales
In Spanish. This interactive unit shows you the statistical relationship between two variables.
University of Colorado
University of Colorado: Ph Et Interactive Simulations: Least Squares Regression
Create your own scatter plot or use real-world data and try to fit a line to it. Explore how individual data points affect the correlation coefficient and best-fit line.
Texas Education Agency
Texas Gateway: Collecting Data and Making Predictions
Given an experimental situation, the student will write linear functions that provide a reasonable fit to data to estimate the solutions and make predictions.
Alabama Learning Exchange
Alex: Statistically Thinking
The object of this project is for learners to learn how to find univariate and bivariate statistics for sets of data. Also, the students will be able to determine if two sets of data are linearly correlated and to what degree. The...
Texas Instruments
Texas Instruments: Line of Best Fit
In these questions, students will find the linear equation of best fit for a set of data and interpret the correlation coefficient. Questions are multiple-choice and true/false; solutions are provided.
Illustrative Mathematics
Illustrative Mathematics: S Id Coffee and Crime
This task addresses many standards regarding the description and analysis of bivariate quantitative data, including regression and correlation. Given a scatter plot, students will answer a variety of questions about linear relationships,...
Texas Instruments
Texas Instruments: Describing Bivariate Data (Two Quantitative Variables)
Students explore the relationship between two quantitative variables in bivariate data using various x-y plots. They compare the relationships for several categories on the same plot. Students calculate the correlation coefficient to...
Texas Instruments
Texas Instruments: Exploring Bivariate Data
Students graph scatter plots and understand the concepts of correlation and least-squares regression. They also perform transformations to achieve linearity in the data plot.
