Texas Instruments
Vandalism 101
Learners explore logic and use Geometer’s Sketchpad and patterns of logic to solve a puzzle.
Curated OER
Birds' Eggs
More than just data, scatter plots are full of information that can be used to answer a variety of questions. This lesson uses a plot with information about bird egg sizes to answer questions about the relationship between length and...
Curated OER
Everything Weather
Hurricanes are the very definition of exciting weather. Your 5th graders can follow this instructional activity and explore hurricanes with the help of Everything Weather software. They will locate information and answer questions about...
Curated OER
The Big Bang-Hubble's Law
In this Hubble's law learning exercise, students use data for galaxies which include their distance and speed. Students make a graph to show the distance to each galaxy and the speed of each galaxy. They use their graph to answer 4...
Curated OER
Activity One Teacher Page: Vehicles In Motion
Young scholars identify variables that affect the system, and specify which variables are independent and which are dependent.
Curated OER
Who's got the fastest legs?
Students use a stopwatch to collect information for a scatterplot. In this fastest legs lessons, students collect data through the taking of measurements, create and find a median number. Students develop an equation and...
Curated OER
Cold Hard Facts...What Inquiring Minds Will Know
Students work with "ice" in order to gain a practical application of math concepts that evolve into an inquiry-based study. They determine if the dimensions of the ice make a difference in the way the ice floats in the water.
Curated OER
Skateboard Disaster
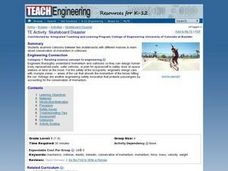
Students conduct a hands-on experiment with collisions between two skateboards of different masses. They are introduced to the concept of conservation of momentum in collisions and consider how their observations might help engineers...
Curated OER
A Closer Look: Unemployment
Students view a video clip about unemployment. They research data and create a scatter plot graph. They discover the importance of graphs and what they can tell us. They create their own publication on unemployment.
Curated OER
Forces and Graphing
Learners analyze graphs to determine relationships between variables and rates of change. They determine the basic concepts about static reaction forces. They determine the slope and equation of a line.
Curated OER
Can You Carry a Tune in a Bucket?
Students use water filled pipes to play a tune and consider the mathematics behind the sound waves. In this sound wave activity, students play a tune with water filled pipes. They create a mathematical model to evaluate the wavelengths...
Curated OER
Gyrocopters-Producing Rotary Motion
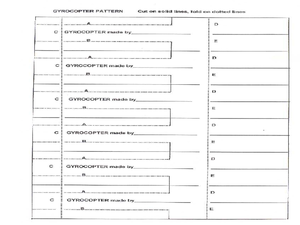
Students demonstrate rotary motion by practicing with gyrocopters. For this physics lesson students work in groups to construct a gyrocopter and explore how physics effect it torque and inertia.
Curated OER
Curve Fitting and the TI-85 Calculator
Seventh graders follow a step-by-step guide for using graphing calculator to determine equations which best fit data graphed. They gather data from various sites on the web, or they do searches to find information necessary to complete...
Curated OER
Obstacles to Success: Misleading Data
Eleventh graders explore how data reported by country agencies can mislead the public intentionally or unintentionally. For this Cross Curricular activity, 11th graders analyze charts and graphs in order to draw conclusions. Students...
Curated OER
TE Activity: A Roundabout Way to Mars
Students investigate Hohmann orbit transfers using cardboard and string while focusing on the orbits of Earth and Mars. They look at the planets orbits around the sun and transfer orbit form one planet to another to determine what a...
Curated OER
STRETCHING SPRING
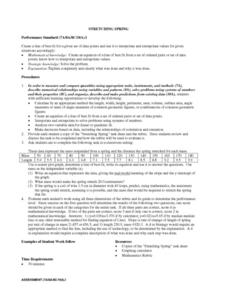
Learners calculate the length, width, height, perimeter, area, volume, surface area, angle measures or sums of angle measures of common geometric figures. They create an equation of a line of best fit from a set of ordered pairs or...
Curated OER
Power, Work and the Waterwheel
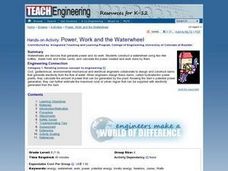
Students use a two-liter bottle, dowel rod and index cards to design and construct a water wheel. They then calculate the power created and measure the work done by the water wheel in Watts and Joules.
Curated OER
Calculus
Young scholars make an inquiry with the aid of technology into the concept of functions. The emphasis of the lesson plan is on the interplay between the geometric and analytic information.
CK-12 Foundation
Ck 12: Scatter Plots and Linear Correlation Grades 11 12
[Free Registration/Login may be required to access all resource tools.] This Concept introdices scatterplots and linear correlation for bivariate data.
Sophia Learning
Sophia: Linear Correlation Tutorial
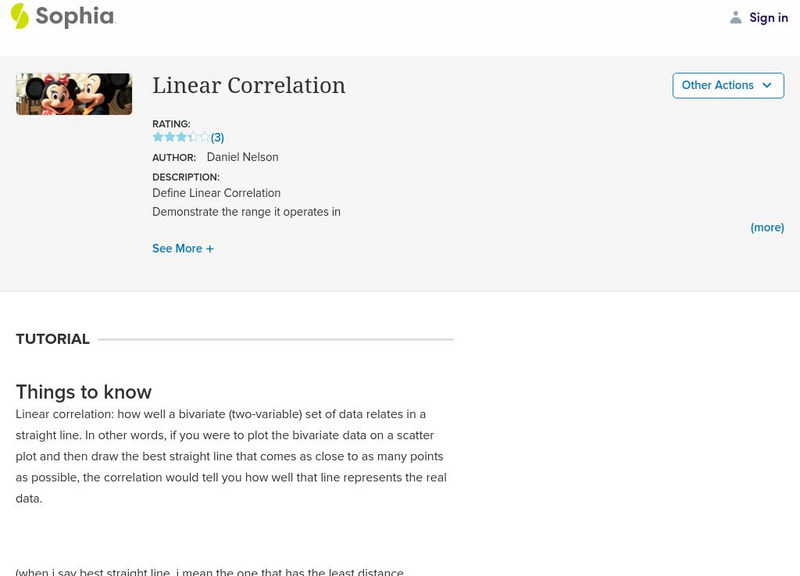
Use examples to determine and explain the linear correlation of independent and dependent variables.
Khan Academy
Khan Academy: Positive and Negative Linear Associations From Scatter Plots
Practice identifying the types of correlations shown in scatter plots. Sometimes we see linear correlations (positive or negative), sometimes we see non-linear correlations (the data seems to follow a curve), and other times we don't see...
CK-12 Foundation
Ck 12: Scatter Plots and Linear Correlation
[Free Registration/Login may be required to access all resource tools.] This lesson covers plotting a scatterplot and finding a linear equation that best fits the data.
CK-12 Foundation
Ck 12: Statistics: Scatter Plots and Linear Correlation
[Free Registration/Login may be required to access all resource tools.] In this tutorial, students learn how to interpret data through the use of a scatter plot.
Shodor Education Foundation
Shodor Interactivate: Linear Regression and Correlation
Students are introduced to correlation between two variables and the line of best fit.
