Curated OER
Flicking Football Fun
Young mathematicians fold and flick their way to a deeper understanding of statistics with a fun, hands-on math unit. Over the course of four lessons, students use paper footballs to generate data as they learn how to create line...
Curated OER
Earthquakes: Sixth Grade Lesson Plans and Activities
Young seismologists learn more about plate tectonics with a set of pre-lab, lab, and post-lab lessons plans on earthquakes. After exploring how waves travel through various materials, sixth graders record their observations and...
Curated OER
Hazards: Sixth Grade Lesson Plans and Activities
Sixth graders explore the damage associated with an earthquake by designing a structure that can withstand earthquake intensities on a shaker board. They then view tips for preparing for an earthquake, and what...
Purdue University
The Represented World: Recreational STEM
How are forces and motion important to a swing set? Scholars explore the concepts of force and motion using swing sets. In preparation for their own STEM design project, individuals take surveys and data from peers, complete labs on...
EngageNY
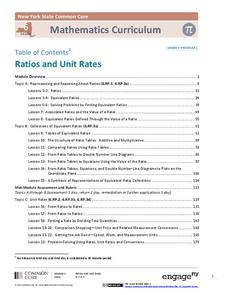
Ratios and Unit Rates
This turn-key unit on ratios and unit rates walks through a 30-lesson unit on teaching proportional reasoning, with each lesson broken into detailed teaching notes and time allotments for all parts. An unbelievable resource when taken...
National Security Agency
What’s Your Coordinate?
Your middle schoolers will show what they know with their bodies when they become the coordinate plane in this conceptual development unit. Starting with the characteristics of the coordinate plane, learners develop their skills by...
Curated OER
Au Revoir Les Enfants Film Comparison/Contrast
In this film analysis worksheet, students compare and contrast one of the themes in "Lord of the Flies" using the film "Au Revoir Les Enfants." Students write a comparison and contrast essay for the activity.
Khan Academy
Khan Academy: Read Line Plots (Data With Fractions)
Practice reading and interpreting data that is graphed on line plots. The data graphed includes fractions. Students receive immediate feedback and have the opportunity to try questions repeatedly, watch a video or receive hints....


