Hi, what do you want to do?
Mangahigh
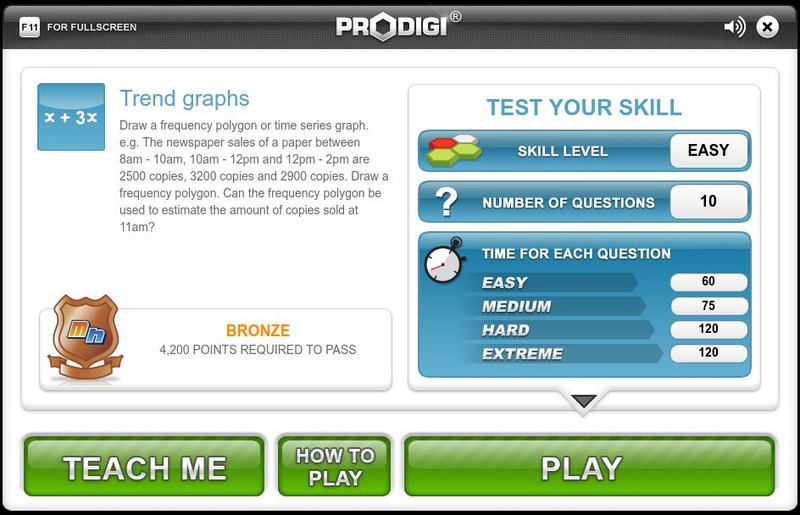
Mangahigh: Data: Trend Graphs
Students explore the concept of frequency trend graphs by working through an online tutorial and then attempting a ten question quiz that increases in difficulty as questions are answered correctly.
Khan Academy
Khan Academy: Make Bar Graphs 1
Practice creating bar graphs (bar charts) from data sets. Students receive immediate feedback and have the opportunity to try questions repeatedly, watch a video or receive hints.
US Department of Education
National Center for Education Statistics: Create a Graph Tutorial
This tutorial walks students through how to create different types of graphs using the Create a Graph tool available on the website. Covers bar graphs, line graphs, pie charts, area graphs, scatter plots, and dependent and independent...
Cuemath
Cuemath: Linear Graph
A comprehensive guide for learning all about linear graphs with definitions, properties, their equations, how to plot or analyze them, solved examples, and practice questions.
CK-12 Foundation
Ck 12: Statistics: Scatter Plots on the Graphing Calculator
[Free Registration/Login may be required to access all resource tools.] This lesson covers finding the equation of best fit using a graphing calculator.
Khan Academy
Khan Academy: Eyeballing the Line of Best Fit
Students practice informally graphing a line of best fit to a scatter plot and answer questions to determine if a scatter plot has a correlation. Students receive immediate feedback and have the opportunity to watch a video, get hints,...
CK-12 Foundation
Ck 12: Algebra: Fitting Lines to Data
[Free Registration/Login may be required to access all resource tools.] Make a scatter plot of data and find the line of best fit to represent that data.
CK-12 Foundation
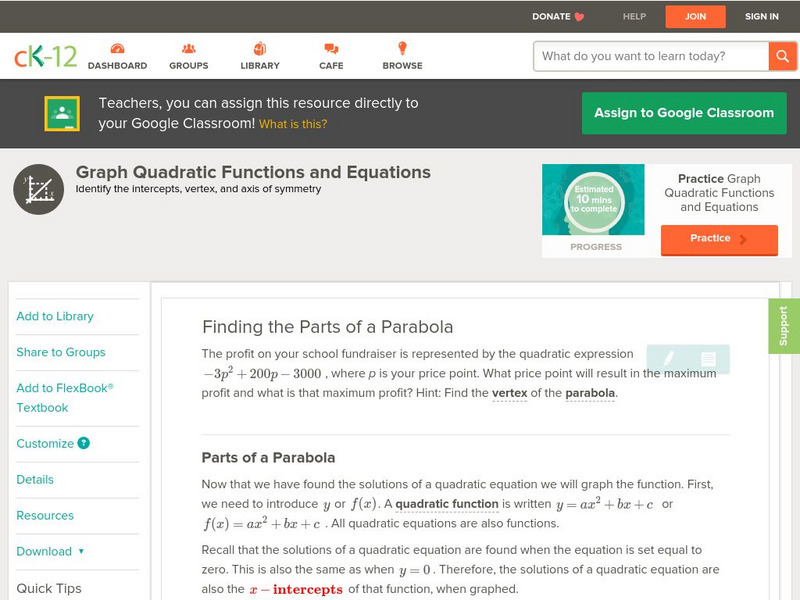
Ck 12: Algebra: Quadratic Functions and Their Graphs
[Free Registration/Login may be required to access all resource tools.] Learn the anatomy of the graph of a quadratic function.
National Council of Teachers of Mathematics
Nctm: Illuminations: Line of Best Fit
Use this activity to practice how to enter a set of data, plot the data on a coordinate grid, and determine the equation for a line of best fit.
University of Illinois
University of Illinois: Line Graphs
Line graphs are shown and explained here. You can learn what kind of data is best represented using a line graph. There are also line graphs with questions and answers available to help you learn how to read them.
The Franklin Institute
Frankin Institute Online: Group Graphing
This site from The Franklin Institute explores how to make a simple graph using a spreadsheet to portray survey data. It also gives a set of interesting sports-related web sites so that students can get statistical inforamtion.
University of Waterloo (Canada)
Univ. Of Waterloo: Wired Math: Linear Graphing: Graphing and Analyzing [Pdf]
The mathematics resource assesses students on linear relations. The activity has problems with graphing and analyzing linear relations. Some of the topics included are variation, scatter plots and linear relationships. The worksheet has...
Khan Academy
Khan Academy: Plotting Inequalities
Create number line graphs of inequalities. Students receive immediate feedback and have the opportunity to try questions repeatedly, watch a video or receive hints.
University of Regina (Canada)
University of Regina: Math Central: Linear Graphs
Students gain the knowledge of how to plot and recognize first degree equations on a graph. The lesson has an overview, materials, procedures, and evaluation techniques.
PBS
Pbs Teachers: Galileo's Battle for the Heavens Plotting Sun Spots
In this activity, students follow in Galileo's footsteps as they examine the nature of sunspot cycles, define solar minimum and solar maximum, and graph data for a solar cycle. Then they will predict the next solar maximum and when the...
Math Aids
Math Aids: Graph Worksheets
Great resource to practice and strengthen math skills pertaining to graphs. Math worksheets are printable, may be customized, and include answer keys.
Texas A&M University
Wtamu Virtual Math Lab: Intermediate Algebra
This site is a tutorial for students in algebra 2 or for those who need a refresher. The site has explanations, definitions, examples, practice problems and practice tests are found covering topics such as linear equations, graphing,...
TeachEngineering
Teach Engineering: A Lego Introduction to Graphing
Students use a LEGO ball shooter to demonstrate and analyze the motion of a projectile through use of a line graph. This activity involves using a method of data organization and trend observation with respect to dynamic experimentation...
Beacon Learning Center
Beacon Learning Center: All That Data
Students analyze data by finding the mean, median, mode, and range of a set of numbers. Line plots, bar graphs, and circle graphs are also included in this lesson.
CK-12 Foundation
Ck 12: Types of Data Representation: Graphic Displays of Data
[Free Registration/Login may be required to access all resource tools.] Here you will explore displays of data using bar charts, histograms, pie charts and boxplots, and learn about the differences and similarities between them and how...
PBS
Pbs Mathline: Sand Babies (Pdf) [Pdf]
In this engaging instructional activity, students use a variety of measurement strategies in creating their own Sand Babies. Students explore standard and non-standard measurements, area, data collection and analysis, and graphing....
TeachEngineering
Teach Engineering: Graphing the Rainbow
Students are introduced to different ways of displaying visual spectra, including colored "barcode" spectra, like those produced by a diffraction grating, and line plots displaying intensity versus color, or wavelength. Students learn...
Shmoop University
Shmoop: Basic Algebra: Graphing Lines by Plotting Points
The tutorial discusses how to graph lines by plotting points. Learners explore the concept through notes and examples. Practice problems are included to check for comprehension of the algebra topic.


