Khan Academy
Khan Academy: Read Line Plots (Data With Fractions)
Practice reading and interpreting data that is graphed on line plots. The data graphed includes fractions. Students receive immediate feedback and have the opportunity to try questions repeatedly, watch a video or receive hints....
Quia
Ixl Learning: Line Plots
Brush up on your math skills relating to line plots then try some practice problems to test your understanding.
Khan Academy
Khan Academy: Graph Data on Line Plots
Record measurements on line plots (also called dot plots). Students receive immediate feedback and have the opportunity to try questions repeatedly, watch a video or receive hints.
Better Lesson
Better Lesson: Graphing Our Snack Mix: Review of Graphing
Second graders review how to make bar graphs, line plots, and pictographs by tallying the contents of snack mix and building graphs to show their data.
ClassFlow
Class Flow: Data Analysis Using Graphing
[Free Registration/Login Required] This flipchart allows students to analyze data using appropriate graphs, including pictographs, histograms, bar graphs, line graphs, circle graphs, and line plots introduced earlier, and using...
Other
Northern Michigan University: Line Plots
The author utilizes a line plot to demonstrate what an "outlier" is, what "clusters" are, and what "gaps" are.
Texas Instruments
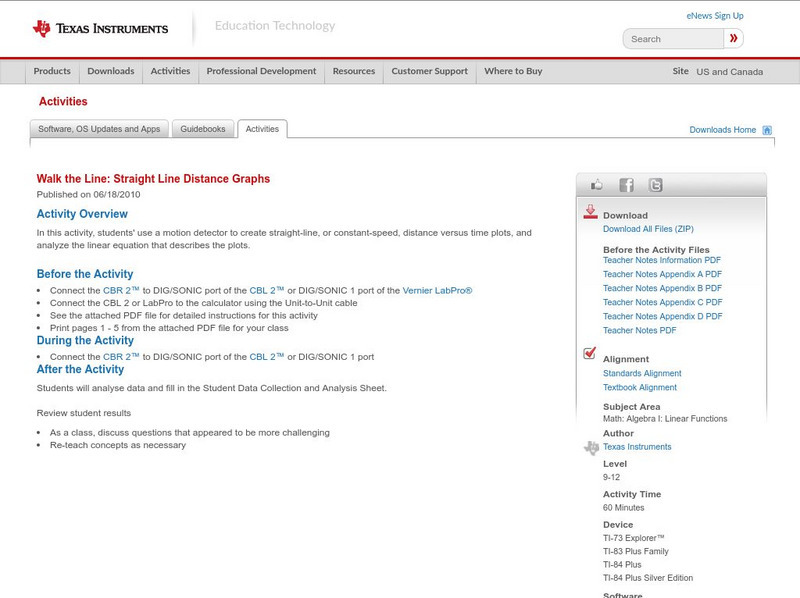
Texas Instruments: Walk the Line: Straight Line Distance Graphs
In this activity, students' use a motion detector to create straight-line, or constant-speed, distance versus time plots, and analyze the linear equation that describes the plots.
Khan Academy
Khan Academy: Creating Dot Plots
Practice creating dot plots. Dot plots are very similar to frequency tables, but they make it easier to see the data. Students receive immediate feedback and have the opportunity to try questions repeatedly, watch a video or receive hints.
Quia
Ixl Learning: Dot Plots
Brush up on your math skills relating to dot plots then try some practice problems to test your understanding.
Mangahigh
Mangahigh: Algebra: Draw Straight Line Graphs
Mangahigh is a website with math games aimed at twelve to eighteen year olds. On this site students plot graphs of explicit linear functions.
BBC
Bb Ci: Exponential Graphs (Higher)
Exponential graphs increase rapidly in the Y direction and will never fall below the X -axis, thus forming a curve.
Other
Online Statistics Education: Graphing Distributions [Pdf]
This is the second chapter of a statistics e-text developed collaboratively by Rice University, University of Houston Clear Lake, and Tufts University. It looks at many different types of data displays and the advantages and...
National Council of Teachers of Mathematics
The Math Forum: Chameleon Graphing: Coordinate Plane
Dive into this introduction to graphing in the coordinate plane, and meet a chameleon named Sam. Sam will help guide you through graphing points on a line, using negative numbers, and graphing points in the coordinate plane.
Mangahigh
Mangahigh: Data: Trend Graphs
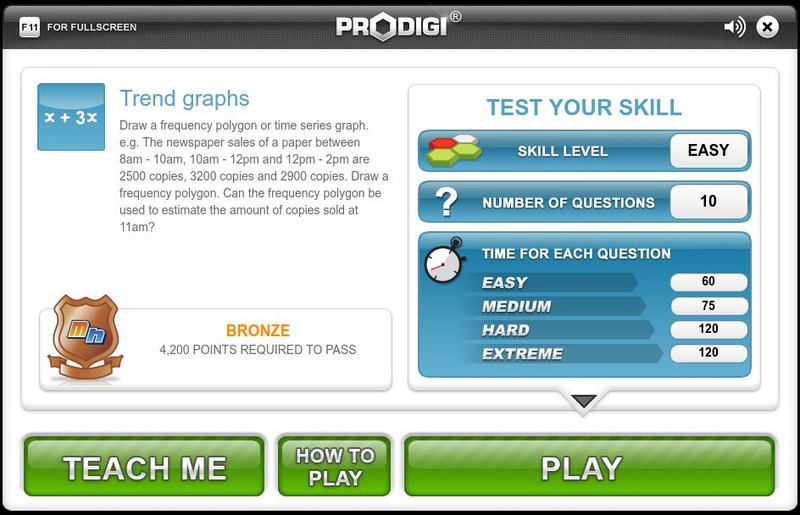
Students explore the concept of frequency trend graphs by working through an online tutorial and then attempting a ten question quiz that increases in difficulty as questions are answered correctly.
Khan Academy
Khan Academy: Make Bar Graphs 1
Practice creating bar graphs (bar charts) from data sets. Students receive immediate feedback and have the opportunity to try questions repeatedly, watch a video or receive hints.
CK-12 Foundation
Ck 12: Statistics: Scatter Plots on the Graphing Calculator
[Free Registration/Login may be required to access all resource tools.] This lesson covers finding the equation of best fit using a graphing calculator.
Khan Academy
Khan Academy: Eyeballing the Line of Best Fit
Students practice informally graphing a line of best fit to a scatter plot and answer questions to determine if a scatter plot has a correlation. Students receive immediate feedback and have the opportunity to watch a video, get hints,...
CK-12 Foundation
Ck 12: Algebra: Fitting Lines to Data
[Free Registration/Login may be required to access all resource tools.] Make a scatter plot of data and find the line of best fit to represent that data.
CK-12 Foundation
Ck 12: Algebra: Quadratic Functions and Their Graphs
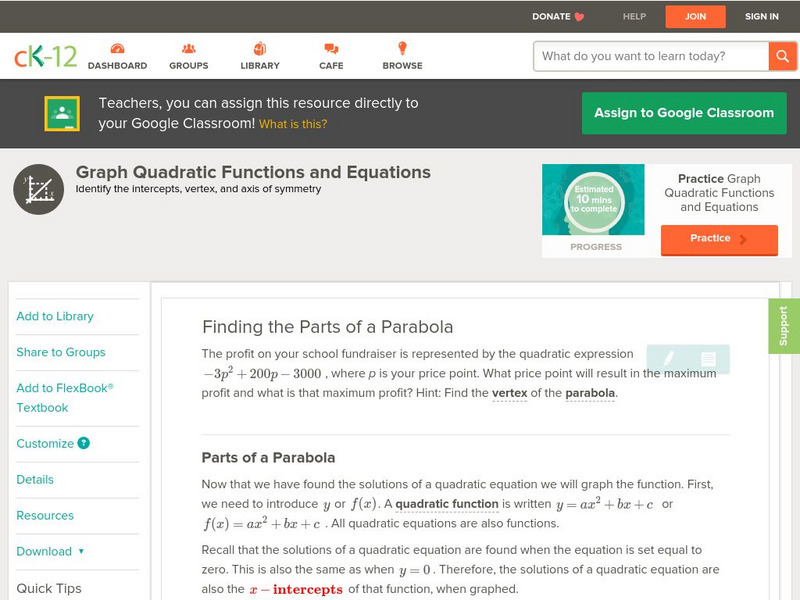
[Free Registration/Login may be required to access all resource tools.] Learn the anatomy of the graph of a quadratic function.
University of Illinois
University of Illinois: Line Graphs
Line graphs are shown and explained here. You can learn what kind of data is best represented using a line graph. There are also line graphs with questions and answers available to help you learn how to read them.
University of Waterloo (Canada)
Univ. Of Waterloo: Wired Math: Linear Graphing: Graphing and Analyzing [Pdf]
The mathematics resource assesses students on linear relations. The activity has problems with graphing and analyzing linear relations. Some of the topics included are variation, scatter plots and linear relationships. The worksheet has...
Khan Academy
Khan Academy: Plotting Inequalities
Create number line graphs of inequalities. Students receive immediate feedback and have the opportunity to try questions repeatedly, watch a video or receive hints.
Texas A&M University
Wtamu Virtual Math Lab: Intermediate Algebra
This site is a tutorial for students in algebra 2 or for those who need a refresher. The site has explanations, definitions, examples, practice problems and practice tests are found covering topics such as linear equations, graphing,...


