Curated OER
Leaping Lemurs! How far can you jump?
Students watch a segment of the PBS video which show the lemurs' ability to jump. In pairs, students collect measurement data involving each other's length of a standard step, a standing broad jump, and a long jump. They record their...
Curated OER
Weather
Students participate in a variety of mini-lessons including experiments, literature readings, physical education components, music, data gathering and recording and more to expose them to several themes of weather; i.e. water cycle,...
Curated OER
Amazing Bean Races
Students experiment with bean growth in varied conditions. In this plant biology lesson, students plant beans in soil and in spun cellulose (absorbent material in diapers) and measure the growth of their seedlings. They...
Curated OER
Human Populations Studies: the Ghost of Populations Past
Learners compile data on population distribution and develop survivorship curves using information from cemetery tombstones and obituaries. They develop inferences on the changes in population age distribution in their area over time.
Curated OER
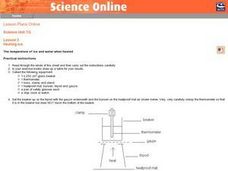
Heating Ice: The temperature of ice and water when heated
Seventh graders read and follow the instructions on the worksheet. They make a table of their results. Students use about 100 cm^3 of water and ice mixture. They heat the water/ice with a Bunsen burner. Temperature is recorded every 30...
Curated OER
Heating of Water: Water Vapour
Seventh graders read the directions printed on their worksheet and follow them carefully. They set up a beaker with a tripod and Bunsen burner under it. They record the temperature of water every 30 seconds. Students graph the data and...
Curated OER
Body Proportion
Fourth graders measure the height and arm span of various classmates. They use a spreadsheet to design a graph that shows the class measurements from tallest to shortest in metric and standard systems.
Curated OER
Heat Loss
Young scholars comprehend how heat loss is affected by exposed surface area. They decide what type of and how many data to
collect. Students decide how the results should be presented. They make a series of accurate observations
Curated OER
Using a spreadsheet and the Internet to learn about stock market performance
Students record the progress weekly of a business of their choice on the stock market, graph those results, research and report on current news and how it pertains to the companies recent performance.
Curated OER
Catching Some Rays
Sixth graders explore the tilt of Earth's axis. In this Earth lesson, 6th graders read a Greek mythology story explaining why there are seasons. Students build a sun-ray gathering tool from styrofoam, glue, thermometers, skewers, and...
Curated OER
Buy Low, Sell High
Learners investigate the stock market and investing in corporate stocks by creating an investment portfolio. They develop database worksheets that track their stock's performance over a specified period of time. Students use their...
Curated OER
Measuring Mania
Students rotate through stations in the classroom, completing different types of measurements. These measurements are placed into a spreadsheet, and a scatter plot is generated. They type an explanation of their results in correlation...
Curated OER
I'm Inclined to See; Physics, Math, Science, Experiments, Graphs
Young scholars discover the motion of a sphere on an inclined plane and discover basic relationships involving distance, time, speed(velocity), and acceleration.
Curated OER
Chart the Weather for Cities Around the World
Learners orally describe Northern and Southern hemispheres, identify 7 continents, and point out specific countries and cities. They locate and record weather information.
Alabama Learning Exchange
Investigating School Safety and Slope
Learners investigate the slope of various stairways through a "news report" approach and employ mathematical knowledge of applied slope to report on wheelchair accessibility and adherence to Americans with Disabilities Act. They...
Curated OER
Rocketsmania And Slope
Students use a professional basketball team's data and graph it on a coordinate plane. They draw a line of regression and finding its equation. They access a website containing statistics for the Houston Rockets basketball team to solve...
Curated OER
Race The Rapper: Slopes
Students calculate the slope of the equation In this algebra lesson plan, students graph coordinate pairs of linear equations and identify the relationship between x and y values and slope. They differentiate between functions and...
Curated OER
Point-Slope Form
Ninth graders explore the point-slope form of linear equations and graph lines in the point-slope form. After completing the point-slope equation, they identify the slope of a line through a particular point. Students explain the...
Curated OER
Standard Linear Form
Ninth graders identify and describe the x-intercept as the place where the line crosses the x-axis as it applies to football. They create their own differentiations to reinforce the distinction between the x-intercept and the...
Curated OER
Relating Distance and Velocity Over Time
Students calculate the distance and velocity over time. In this algebra lesson, students graph a linear function to represent the distance vers time travel. They interpret their graphs and draw conclusion.
Curated OER
To Be Linear or Not to be Linear, That is the Question
Students use their knowledge and understanding of equations of lines to explore independent and dependent variables. They determine how to isolate a variable and how to predict data points not represented in data.
Curated OER
Choosing a Summer Job
What did you do over your summer vacation. Young wage earners must compare summer job options, and determine when each job earn the same amount and what that amount be. This be done by creating, graphing, and solving systems of...
Curated OER
Word Problems
Students solve word problems using mathematical symbols. In this algebra lesson, students collect data and analyze it. They analyze the data using a table or graph after plotting the data.

