Curated OER
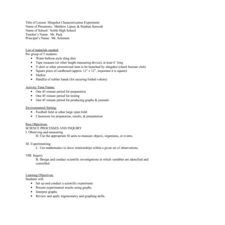
Slingshot Characterization Experiment
Students set up and conduct a scientific experiment to demonstrate data collection. In this scientific process lesson, students complete an activity with the specific objective of using a slingshot to fire a t-shirt into the crowd at a...
Curated OER
Betweenness and the Sum of Parts
High schoolers differentiate lines and angles using betweenness in this geometry lesson. They differentiate angles and lines using Cabri Jr. and analyze the data and make conjecture.
Curated OER
Biological and Agricultural Engineering
Eighth graders explore mathematics by conducting a series of investigations using a colorimeter. In this math lesson, 8th graders explain the purpose of food irradiation. They collect data and graph them.
Curated OER
Mass Spectrometer
For this mass spectrometer worksheet, students read about how a mass spectrometer determines the elements in gases around Earth. Students answer 3 questions and identify the elements in a graph found by a mass spectrometer.
Curated OER
Mapping West Virginia
Fourth graders explore West Virginia. In this Unites States geography lesson, 4th graders discuss the type of land and the cities in West Virginia. Students create two overlays, with transparencies, that show the natural land and the...
Curated OER
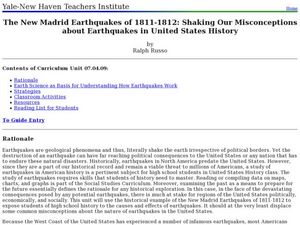
The New Madrid Earthquakes of 1811-1812: Shaking Our Misconceptions about Earthquakes in United States History
Students Examine how earthquakes work and what plate tectonics and fault lines are. For this earthquake lesson students complete an earthquake scavenger hunt.
Curated OER
Chart the Stars
Seventh graders find constellation distances and plot the stars. For this star lesson, 7th graders plot the star points for Canis Major. Students use graphing calculators to graph the constellation. Students choose another constellation...
Curated OER
M&M Exponential Activity
Young scholars create a scatter plot of their experimental data. In this algebra lesson, students use M&M's to determine an algebraic model. They discuss results in class.
Curated OER
Statistical Accuracy and Reliability
Ninth graders assess the accuracy and reliability of current survey data and how it is represented. They design a survey, collect data, and use technology to analyze the data and present the results. Students examine scatter plots and...
Curated OER
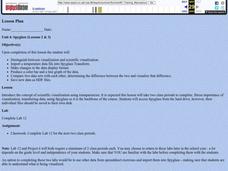
Spyglass
Students distinguish between visualization and scientific visualization. They use the software program Spygalss to create images from two-dimensional arrays of numbers.
Virginia Department of Education
How Much is that Tune?
Tune in for savings! Scholars investigate pricing schemes for two different online music download sites. After comparing the two, they determine the numbers of songs for which each site would be cheaper.
Computer Science Unplugged
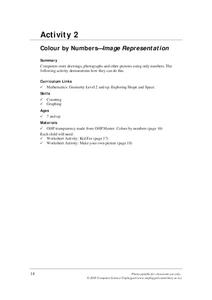
Colour by Numbers–Image Representation
How do computers store and send images? Here's an activity that explains one way a computer can compress image information. Pupils decode run-length coding to produce a black and white image. Pairs then work together to code and...
Wild BC
Bearly Any Ice
After reviewing food chains, your class members participate in an arctic predator-prey game that exemplifies the impact of climate change of food availability. If you are in a hurry, skip this lesson, but if you have the time to...
AIMS Education Foundation
Classroom Olympics
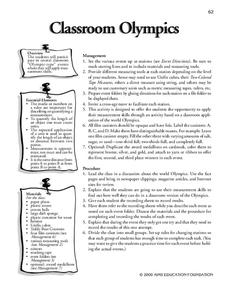
As the Summer Olympics are approaching, incorporate Olympic-type games into the classroom. From straw javelin to cotton ball shot put, these games are sure to keep leaners engaged. The best part is that there is math involved! Pupils...
Baylor College
Needs of Plants
What better way to learn about plant life than by creating a class garden? Young botanists start with a brief discussion about radishes before planting seeds and watching them grow. To determine the importance of water,...
Curated OER
Introducing Linear Terminology
Ninth graders graph linear equations and inequalities in two variables and then, they write equations of lines and find and use the slope and y-intercept
of lines. They use linear equations to model real data and define to define the...
Curated OER
Linking Algebra to Temperature
Learners convert between two units as they calculate the temperature. In this algebra lesson, students collect data on seasonal climate and create a graph. They make conjectures based on their data collection.
Curated OER
Can you Find the Expression
Pupils collect data from measurements and weights for this experiment. In this algebra lesson, students analyze graphs they create form their data to find the expression representing the data. They label which graph provided the best...
Curated OER
What's The Point?
Students solve word problems using the correct math symbols. For this algebra lesson, students use the TI calculator to graph their equation and analyze it. They find the line of regression and use to draw conclusion.
Curated OER
Holey Clamshells
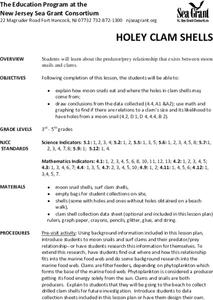
Students analyze data to make hypotheses and conclusions regarding the predator/prey relationship between moon snail and surf clams.
Curated OER
Car Maze competition
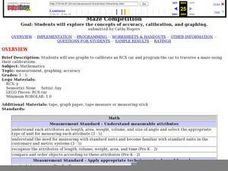
Students use graphs to calibrate an RCX car. They must then program the car to traverse a maze using their calibrations
Curated OER
How Far Will It Roll?
Students construct a car with the longest roll using a ramp. They construct Lego cars, modify the wheel sizes and car configurations to evaluate which car design rolls the longest distance, develop a graph, and complete a worksheet.
Curated OER
Sunspot Activity
In this space science worksheet, high schoolers find the data that is needed to help them acquire the knowledge concerning sunspots through observation and data collection.
Curated OER
Linear Equations and Cell Phone Plans
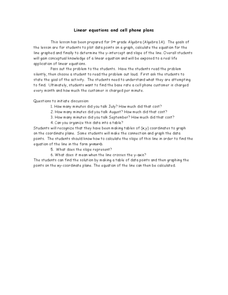
Young scholars calculate the amount of minutes they get charged for each month. For this algebra lesson, students relate linear equations to talking on the phone and the cost to do so. They create graph to plot the cost and usage of the...
