Curated OER
Linear Functions-Learn Your Lines
Students solve and graph linear equations. In this algebra lesson, students collect and plot data on a coordinate plane. They use the CBL and TI calculator to graph systems of equation.
Curated OER
How Much Data is That?
Students differentiate between exponential and logarithmic functions. In this algebra activity, students use logarithmic properties to solve equations. They identify growth and decay of graphs.
Curated OER
Linear Patterns in Data
Eighth graders extend their learning of graphing linear equations and are introduced to connecting patterns in tables and graphs to represent algebraic representations. They then determine patterns and extrapolate information from these...
Curated OER
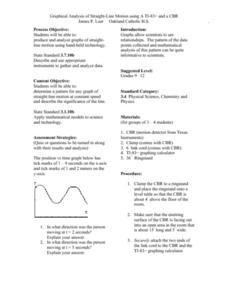
Graphical Analysis of Straight-Line Motion
Students investigate the concept of straight line motion. They determine the pattern and graph it looking for the motion maintained at a constant speed. Students also write a description of the significance of the line. The skill of...
Curated OER
Graphing Your Motion
Seventh graders investigate velocity and speed. For this Vernier Probe lesson, 7th graders will use probes to calculate motion, speed, and velocity of an object. They will create a graph of their collected data.
Curated OER
Graphing Linear Equations
Learners graph linear equations. In this algebra lesson plan, students investigate the price of tolls in different states and create a graph. They analyze their graph and draw conclusions.
Curated OER
Straight Line Motion with a Stomper
Young scholars explore average speed, and graph distances and time. In this speed and velocity lesson students complete a lab then calculate distances, acceleration and velocity and graph the data.
Curated OER
Logarithmic Transformations of Data
Students investigate and study logarithmic equations. In this precalculus lesson, students analyze the data behind the function. They define each graph as positive, negative or no correlation. They find the line of best fit.
Curated OER
Graphing Real World Situations
Students solve linear equations using graphs. In this algebra lesson, students depict real life situation using lines and functions. They identify the slope, data and predict graphing behavior.
Curated OER
Snow Cover by Latitude
Students create graphs showing the amount of snow coverage at various points of latitude and compare graphs.
Curated OER
Solar Cell Energy Availability From Around the Country
Students determine areas that are the most likely to produce solar energy by using NASA data. In this solar energy lesson students analyze plots and determine solar panel use.
EngageNY
Scatter Plots
Scholars learn to create scatter plots and investigate any relationships that exists between the variables with a lesson that also show them that statistical relationships do not necessarily indicate a cause-and-effect...
Curated OER
Make a Pass at Me
Young scholars identify different types of functions and units of measurements. In this statistics instructional activity, students will collect data, graph their data and make predictions about their data. They plot a linear...
Curated OER
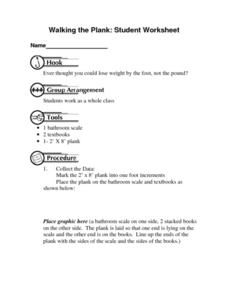
Walking the Plank: Student Worksheet
In this math worksheet, students will work in a group to experiment with the weight of objects when placed at a distance from a scale (using a plank). Students will record and graph their results.
Curated OER
Which Car Should I Buy?
Students use gas mileage of different cars to create T charts, algebraic equations, and graphs to show which gets better mileage. In this gas mileage lesson plan, students use the graph to see which car they should buy.
Curated OER
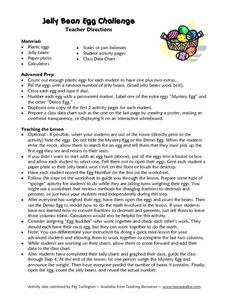
Jelly Bean Egg Challenge
Students each receive a plastic egg filled with jelly beans. In this Jelly Bean Egg Challenge, students estimate and weight their eggs, they count the number of jelly beans inside their egg, they chart their data and compare their data...
Curated OER
Univariate Data Analysis
Students use given data to compare baseball players. They create box and whisker plots to compare the players and determine which they feel is the best player. Students use calculators to make box and whisker plots. They write paragraphs...
Curated OER
Evidence of Change Near the Arctic Circle
Learners analyze graphs and make conclusions about climate change. In this climates lesson students produce graphs and identify relationships between parameters.
Curated OER
Radioactive Simulations
Young scholars simulate radioactive decay and nuclear power using an on line interactive web site. In this on line lesson plan, students monitor radioactive isotopes and record the activity of a particular element as the decay...
Curated OER
Who's got the fastest legs?
Students use a stopwatch to collect information for a scatterplot. For this fastest legs lessons, students collect data through the taking of measurements, create and find a median number. Students develop an equation and...
Curated OER
Exploring Linear Equations And Scatter Plots - Chapter 5 Review
Students complete rolling stocks experiment, and collect and enter data on the computer. They enter data on graphing calculators, complete scatter plot by hand with line of best fit, and discuss different graphing methods.
Center Science Education
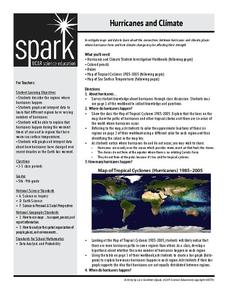
Hurricanes and Climate
Feeling under the weather? This instructional activity on hurricanes can whip things up! With professionally designed maps and handouts, teach your future weathermen (or women) where, when, and how hurricanes occur. They identify...
Curated OER
Pumpkin Play
Have you ever examined a pumpkin and estimated the number of lines it has? In this math lesson plan, students count the actual number of lines, record and graph the results. They investigate the circumference, weight and buoyancy of the...
Curated OER
Move It
Studens collect and graph data. In this algebra instructional activity, students use a CBL and CBR with a TI Calcualtor to observe linear graphs. They use the correct vocabualry as they discuss the collected data.


