Illustrative Mathematics
Weather Graph Data
Teaching young mathematicians about collecting and analyzing data allows for a variety of fun and engaging activities. Here, children observe the weather every day for a month, recording their observations in the form of a bar graph....
Curated OER
Storms and Extreme Weather
Students explore hurricanes and tornadoes by conducting an experiment. For this weather pattern lesson, students define many extreme weather vocabulary terms and discuss the relationship with static electricity. Students utilize plastic...
Curated OER
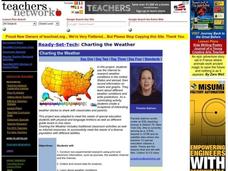
Charting the Weather
Students research and conduct non-experimental research, such as journals, the weather channel and the internet, to collect and record data for analysis on weather conditions in the United States and abroad. They identify, pronounce and...
Curated OER
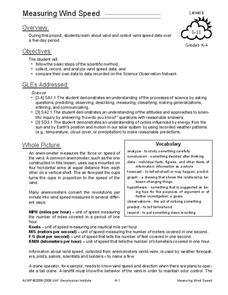
Measuring Wind Speed
Students study wind speed and collect wind speed data. In this wind speed lesson, students visit a website to learn about the local wind speed forecast for their week. Students discuss wind and wind speed. Students collect wind speed...
Curated OER
How Wet Did It Get?
Students measure the rainfall/snowfall on the playground on a rainy/snowy day with a rain/snow gauge. They draw a bar graph representing the amount of water that fell and observe a satellite image of the clouds and local weather system...
Curated OER
Clifford Learns About the Four Seasons and So Do We!
Students explore the seasons and months of the year through literature, math, art and movement. They identify the month of their birthday and in which season it comes. Students name the four seasons and they memorize a poem to recite the...
Other popular searches
- Kindergarten Weather Unit
- Second Grade Weather Unit
- Weather Unit Plan Clouds
- Fourth Grade Weather Unit
- Weather Unit Plans
- Severe Weather Unit
- Winter Weather Unit
- Geography Weather Unit
- Weather Unit Outlines
- Weather Unit Math
- First Grade Weather Units
- Local Weather Unit


