Curated OER
Likely Outcomes
A coin toss is a simple and fun way to help youngsters discovery probability. Preferably in partners, they first predict what would happen if they tossed two coins 48 times. How often would two heads show up? Two tails? How about one of...
Curated OER
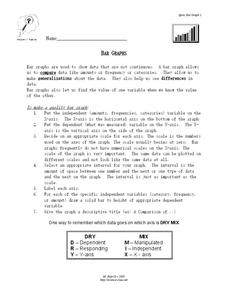
Bar Graphs
In this bar graph worksheet, students read about making quality bar graphs and they make a bar graph using given data. They answer 5 questions about their graph.
Curated OER
Olympic Bar Graphs
In this Olympic bar graph worksheet, young scholars pick a sport from the 2004 Olympic games and find data from the Olympic web page. They graph the scores (times, distance, or speed) and the medals. They answer questions about the...
Curated OER
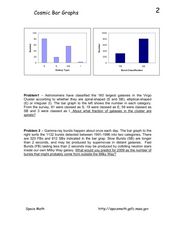
Cosmic Bar Graphs
In this cosmic bar graph activity, students solve 2 problems using given bar graphs that plot the number of galaxies vs. the galaxy type and the number of gamma-ray bursts vs. the burst classification. Students find the fraction of...
Curated OER
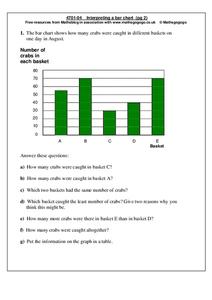
Interpreting a bar chart
In this bar chart worksheet, students analyze a bar chart and answer 7 questions pertaining to the information on the chart. The answers are on the second page.
Math Mammoth
Bar Graphs 1
In this bar graph activity, students organize data in a frequency table, then create a bar graph. They find the average of the data. This one-page activity contains two multi-step problems.
Curated OER
Double Bar Graphs (Reteach 15.1)
In this graphs worksheet, students analyze the data on two double bar graphs. Students answer 4 questions about the information on the graphs.
Curated OER
Frequency, Histograms, Bar Graphs and Tables
In this frequency instructional activity, students interpret histograms, bar graphs and tables. They examine frequency charts and comparison line graphs. This three-page instructional activity contains 4 problems. Answers are provided...
Curated OER
Integrated Algebra Practice: Frequency Histograms, Bar Graphs and Tables
In this graphs instructional activity, students solve 4 problems about histograms, bar graphs, and tables. Students answer questions about histograms, bar graphs, and tables.
Curated OER
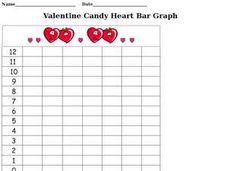
Valentine Candy Heart Bar Graph
For this Valentine candy heart bar graph worksheet, students complete a bar graph illustrating how many different colored candy hearts they received for Valentine's Day.
Jude Mphoweh
Graphs
Searching for worksheets to include in an elementary math series on bar graphs? Then look no further! This collection of materials has exactly what you need to ensure that your students get plenty of practice reading and analyzing the...
Curated OER
How Do You Like To Eat Your Apples?-- Class Bar Graph
For this math worksheet, students collaborate as a group to plot data pertaining to their favorite ways to eat apples: sliced, pie, whole, sauce, caramel or muffin. Students record their class data on the bar graph.
Curated OER
Math Word Problems: Reading Bar Graphs
In this math word problems-reading bar graphs worksheet, learners analyze the bar graph and answer six questions about the data in the graph.
Curated OER
How Does Your Animal Move?---Class Bar Graph
Animals move in interesting ways! Get your young learners to examine various types of animal movement in this group graphing activity. Although directions are not explicit, it seems learners are assigned an animal and categorize the...
Curated OER
Graphs that Represent Data Sets
These four scenarios all contain graphable data; can scholars match them to the correct bar graphs? All the data is in single-digit whole numbers. Some of the scenarios instruct kids to make a graph, while others don't. Clarify...
Curated OER
Survey of Height
In this data collection worksheet, learners survey the heights of their fellow classmates, organize their data in a data table, and create a bar graph from their data. Once bar graph is completed, students complete 2 short answer...
Curated OER
How Soluble Is It?
Is sugar more soluble than salt? Experiment with water and solubility with an elementary science activity. After interpreting data from a bar chart, fifth graders use different types of sugar to determine if the size of sugar particles...
Curated OER
Math--Pictures and Bars--Learning About Graphs
What is a graph? What does it tell us? How do you make one? These are all questions that are answered in the included packet. It's a great introduction to graphing for young learners!
Illustrative Mathematics
Buying Protein Bars and Magazines
Packing for a trip? This activity allows learners to decide how many magazines and protein bars they can buy with twenty dollars. They can organize their work in a chart to track how many items they can purchase. There are two different...
Curriculum Corner
Learning Fun with Hershey Bars
Compiled of 18 task cards and five worksheets, young mathemmaticians practice solving fraction word problems and other fraction-based activities with a Hershey Bar. The packet comes with sheets to record and keep track of all of the task...
West Contra Costa Unified School District
Work Problems – Bar Models
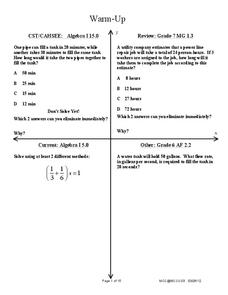
Why do we have to do so much work? Scholars learn how to set up bar models to represent a situation involving work. They use these bar models to help set up equations with rational coefficients to solve the problem situation.
Curated OER
Count the Images!
Based on a selection of images, learners create a bar graph depicting how many of each image is shown. There are two graphs, each with three images to chart. After they are finished, scholars can analyze the data and draw conclusions. To...
Curated OER
Candy Bars
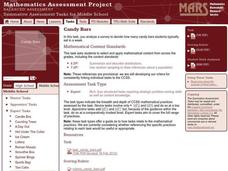
There is often more to data than meets the eye. Scholars learn that they need to analyze data before making conclusions as they look at data that describes the number of candy bars boys and girls eat. They disprove a given conclusion and...
Math Mammoth
Word Problems
Upper grade and middle school learners problem solve and calculate the answers to twenty various word problems involving multiplication, and a bar graph.
Other popular searches
- Fraction Bars
- Hershey Fraction Bars
- Fractions With Chocolate Bars
- Candy Bars
- Fractions With Hershey Bars
- Math Comparison Bars
- Measurement Bars
- Fractions Fraction Bars
- Fractions and Fraction Bars
- Hersey Bars
- Integer Bars
- Make Fraction Bars


