Curated OER
Exploring Function Graphs
Tenth graders investigate three different sets of data that relate temperature to another variable in the physical world. These illustrate linear, inverse and exponential relationships.
Curated OER
Graphing Trigonometric Functions
The student should be able to transfer his knowledge of graphing functions to graphing trigonometric functions. Student should be able to graph trigonometric functions, find amplitude, period, and frequency.
02 x 02 Worksheets
Factoring
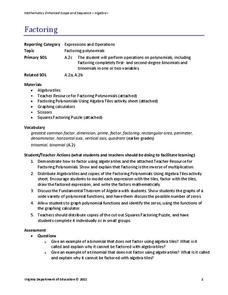
Factor in this resource when teaching how to factor polynomials. Scholars use algebra tiles to factor linear and quadratic expressions. They practice their skill by working on example problems from a worksheet.
Virginia Department of Education
Inequalities
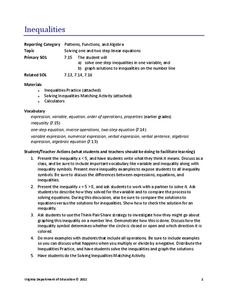
Not all resources are created equal — and your class benefits! Scholars learn how to solve one-step inequalities using inverse operations. They complete an activity matching inequalities to their solutions.
Virginia Department of Education
Equations
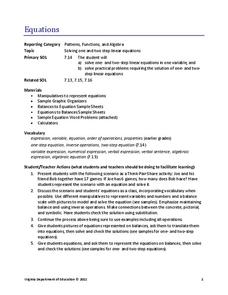
Science equipment can be handy for math class, too. Scholars learn to solve one- and two-step linear equations by using the concept of a balance. They solve real-world problems in a variety of contexts by writing and solving linear...
Curated OER
Graphing Review
Pupils review the principles of graphing linear functions. They discuss plotting points on a coordinate plane, solving using a table, and then graphing. Students solve problems and determine the slope of the line, y-intercept and if...
NASA
Lights on the International Space Station
Groups explore illumination with NASA's Lighting Environment Test Facility (LETF) as a context. Using the TI-Nspire app, groups determine the lux equation that models their simulation. They then use the lux equation to solve problems...
Alabama Learning Exchange
Technology for Displaying Trigonometric Graph Behavior: Sine and Cosine
Students explore the concept of sine and cosine. In this sine and cosine lesson, students work in groups to graph sine and cosine functions. Students examine how coefficients in various parts of each parent function shift the graph. ...
Curated OER
Oodles of Poodles
Students solve equations by graphing. In this algebra lesson, students differentiate between functions and relations. They use the TI to graph their equation and analyze the graph.
Curated OER
Stressed to the Breaking Point
Students explore the relationship between the amount of weight that can be supported by a spaghetti bridge, the thickness of the bridge, and the length of the bridge to determine the algebraic equation that best represents that pattern...
Curated OER
Activity One Teacher Page: Vehicles In Motion
Students identify variables that affect the system, and specify which variables are independent and which are dependent.
Curated OER
Investigating Correlation
High schoolers investigate different types of correlation in this statistics lesson. They identify positive, negative and no correlation as it relates to their data. They then find the line of best fit for the plotted data.
Curated OER
Discovering Math Concepts in Business Mathematics, Economics, and Finance
Explore the concept of money and research its origin. There are many concepts related to business math, thusly, there are many formulas used to make calculations around money. Exchange rates of money in different countries, interest,...
Curated OER
Power, Work and the Waterwheel
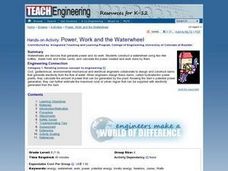
Middle schoolers use a two-liter bottle, dowel rod and index cards to design and construct a water wheel. They then calculate the power created and measure the work done by the water wheel in Watts and Joules.
Curated OER
Conjectures and Conclusions
Learners draw conclusions and make conjectures given a specific scenario. In this geometry lesson plan, students model real life scenarios using properties of triangles. They model number facts and explain why the outcome is what it is.
Pennsylvania Department of Education
Alike and Different
Students compare and contrast objects and are introduced to a Venn Diagram. In this alike and different lesson plan, students make observations regarding properties of objects. Students classify object and build ideas about variables....


