Curated OER
Graphing
Fifth graders create graphs based on climate in South Carolina. They read and interpret information in a chart and construct a graphy from the information in the chart. They create a spreadsheet using Excel and publish 2 graphs.
Curated OER
Data Analysis, Probability, and Discrete Math: Lesson 6
Eighth graders engage in a lesson that is concerned with the concepts surrounding the interpretation of information included in graphs for analysis of data for probability. They examine circle graphs and differentiate the values of...
Curated OER
An Apple A Day
Students create a graph that showcases their pick for favorite kind of apple. Students are given samples of a variety of apples to determine their favorite in a taste test. They a create a tally chart of favorite kinds apples and use a...
Curated OER
Water: From Neglect to Respect
The goal of this collection of lessons is to make middle schoolers more aware of the ways in which they are dependent upon water to maintain their standard of living. Learners compare water use in Lesotho to water use in the United...
Curated OER
Statistics of Mars
Students explore the concept of central tendencies. In this central tendencies lesson, students sort M&M's or Skittles based on color. Students graph their results. Students find the mean, median, and mode of their data.
Curated OER
Handling Data: Representing Date - Online Version
Here is an online lesson plan on data representation. In it, learners access websites embedded in the plan which lead them through a variety of activities around data representation and statistics. The activities are quite good, and...
Curated OER
How Has Math Evolved?
Eighth graders pick a topic or person to research related to the history of mathematics. They brainstorm and create a concept map, using the multimedia software inspiration, about what they are researching and want to examine. They then...
Curated OER
Pumped Up Gas Prices
Students calculate gas prices. In this transportation lesson, students tally the mileage and gas costs of their car for one months. They figure out how much was spent on gas and create a graph showing average gas prices over time.
Curated OER
Shop 'Til You Drop
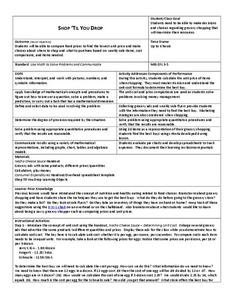
Students evaluate food prices. In this real world math lesson plan, students compare the cost of various grocery items to determine which is the best deal. They work in groups using grocery ads to decide how to get the most product for...
Curated OER
Personal Budgeting Project
Students create an Excel spreadsheet of a personal budget by estimating their possible income and monthly expenses from a worksheet. They group together to create a family unit and use the personal budget sheets to plan a family budget.


