Curated OER
Cindy and Linda - Selling Lemonade
In this pie charts worksheet, learners use the pie chart to count how many glasses of Lemonade were sold by Cindy and Linda. Students complete the table and answer 3 questions.
Curated OER
Getting Graphs: Researching Genealogy-A Piece of Pie
Third graders research their genealogy. In this math lesson, 3rd graders collect data and create graphs and charts. A presentation of their findings is given.
Curated OER
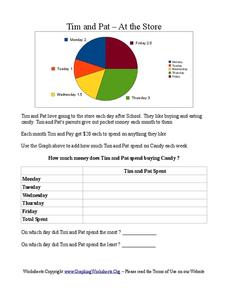
Tim and Pat - At the Store
In this pie chart worksheet, students use the pie chart to add the amount of time Tim and Pat spend buying candy each day of the week. Students answer 2 questions about the table.
Curated OER
Data Handling
In this data handling worksheet, students explore multiple ways to represent data. They create stem and leaf plots, histograms, and bar charts. Students examine and interpret diagrams and statistics. This eleven-page worksheet...
Curated OER
Meet The Graphs
Students identify two types of graphs. They analyze and interpret authentic data shown in bar and pie graphs and complete a graph given specific data. Perform simple functions within an Excel document:
Curated OER
Graphing Favorite Fruit
Third graders take poll and sort data, enter the data to create a spreadsheet and create bar and pie graphs.
Curated OER
Count The Letters
Students perform activities involving ratios, proportions and percents. Given a newspaper article, groups of students count the number of letters in a given area. They use calculators and data collected to construct a pie chart and bar...
Curated OER
Data Display
Students explore different ways to display data. In this statistics instructional activity, students create pie charts, bar graphs and line graphs to show data. Students then write a paragraph discussing which types of graphs are helpful...
Curated OER
Graphs Review
Seventh graders review different types of graphs such as bar graphs, line graphs, box & whisker plots. As a class, they read a story and construct graphs to solve the data in the story. Students play "Graph Jeopardy" which requires...
Curated OER
Usage and Interpretation of Graphs
Students review graphing and use processing skills to solve problems.
Curated OER
Graphing
Students collect data to create different types of graphs-line, pie, and bar graphs. They use StarOffice 6.0 to create graphs.
Curated OER
Mr. Cobbler's Shoe Dilemma
Students employ statistics to solve real-world problems. They collect, organize and describe data. They make inferences based on data analysis. They construct, read, and interpret tables, charts and graphs.
Curated OER
Show Me!
Learners analyze and interpret graphs. In this graphing lesson, students view a video and construct their own graphs (line, circle, bar) from given sets of data.
Curated OER
Ratios Through Social Studies
Students analyze and integrate mathematical concepts within the context of social studies. They gather, present and analyze information on a bar graph, pie chart, etc. Students compute ratios. They demonstrate that ratios have real-world...
Curated OER
Chocolate Preferences Voting and Graphing Techniques
Students practice sampling and graphing techniques. In this data collection and interpretation instructional activity, students write and conduct surveys about chocolate preferences and then collect their data. Students graph the data in...
Curated OER
The Numbers Tell the Story
Students demonstrate how to gather and interpret statistical data. In this data analysis lesson plan, students search for statistics on the health effects of smoking and place the information into charts. Students create these charts...
Curated OER
Sunspot Activity
In this sunspot activity worksheet, students are given a table with 3 types of flares produced by sunspots based on their brightness. Students answer 5 questions by interpreting the data and they determine the percentages of the...
Curated OER
Circle Graphs
Sixth graders interpret, create, and display data in a circle graph. In this circle graph lesson plan, 6th graders use a compass, protractors, pizza boxes, and more to create a circle graph and analyze the data they put into it.
Curated OER
Candy is Dandy
Learners investigate color distribution in bags of M&Ms They sort and classify the contents of a bag of M&Ms and summarize their findings on a worksheet. Students convert the numbers into charts and make predictions about color...
Curated OER
Graphing Data Brings Understanding
Learners collect, graph and analyze data. In this statistics lesson plan, students use circle, pie, bar and lines to represent data. They analyze the data and make predictions bases on the scatter plots created.
Curated OER
Doing The School Run
Students explore finding the percent of a numbers. They survey their peers to determine modes of transportation used in getting to school. Afterward, students organize information and create graphs and charts. They explore alternative...
Curated OER
Data Collection and Presentation
Students concentrate on discrete quantiative data. They are shown that the vertical line diagram as a more appropriate way to present discrete quantiative data then bar charts. Students work as a group to help with the interpretation...
Curated OER
Graphing
Fifth graders create graphs based on climate in South Carolina. They read and interpret information in a chart and construct a graphy from the information in the chart. They create a spreadsheet using Excel and publish 2 graphs.
Curated OER
Data Analysis, Probability, and Discrete Math: Lesson 6
Eighth graders engage in a lesson that is concerned with the concepts surrounding the interpretation of information included in graphs for analysis of data for probability. They examine circle graphs and differentiate the values of...


