Curated OER
What's Your Favorite Stuffed Animal?
Second graders gather information in a survey and interpret the results using a tally chart, a table, and a bar graph. They' present their results of the during the final group discussion. The subject of the survey is favorite stuffed...
Curated OER
The Stock Exchange Phase I
Second graders select a stock and follow its ups and downs, using graphs to show its success.
Curated OER
Home on the Biome
Fifth graders study six major biomes, graph temperature and rainfall, and present their findings to the class.
Curated OER
Down by the Bay
Students listen to teacher read books about fish and participate in activities in order to explore how to identify bluefish. They count and graph the numbers of fish they find in simulated fishing activities.
Curated OER
Surface Meteorological Observation System (SMOS)
Students monitor local surface weather conditions for at least 30 days. They interpret the data by graphing it and detemining percentages.
Curated OER
Space: The Final Frontier
Sixth graders construct a graph to demonstration information that they've learned about the solary system. They also write or illustrate a sonar or lunar eclipse.
Curated OER
Introduction to Science
Seventh graders investigate scientific methods to solve problems. They demonstrate creating data tables and graphs. They study the role of a scientist and the importance of safety in a science lab. They distinguish between an...
Curated OER
Box and Whisker Plots
Seventh graders explore the concept of box and whisker plots. In this box and whisker plots instructional activity, 7th graders plot data on a box and whisker plot. Students discuss the mean, median, and mode of the data. Students...
Curated OER
The Bigger they Are . . .
Students do a variety of data analyses of real-life basketball statistics from the NBA. They chart and graph rebounding, scoring, shot blocking and steals data which are gathered from the newspaper sports section.
Curated OER
The Great Chile Challenge
Fifth graders gather data, create a graph, and interpret information. They build vocabulary by negotiating the ideas that go into the graphs which they create. They use Excel to print a variety of graphs based on how much they like Chile...
Curated OER
Lift Equation Problem Set
Students, after reading an explanation from a NASA Web-based textbook, demonstrate an understanding of the text by using it, along with FoilSim, to complete an activity to graph and interpret the lift equation.
Curated OER
Measuring the Speed of a Wave
Students create an experiment in which they measure the speed of a wave and record the data in a graph. They work in small groups to write the procedure for the experiment and share it with another group for cross checking of the...
Curated OER
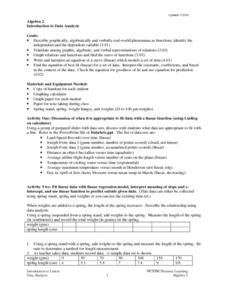
Introduction To Data Analysis
Seventh graders investigate the concept of looking at the data put in a variety of ways that could include graphs or data sets. They analyze data critically in order to formulate some sound conclusions based on real data. Students graph...
Curated OER
Wing Specifications
Ninth graders use FoilSim to fulfill the specifications of a given airfoil (wing) and plot and interpret graphs.
Curated OER
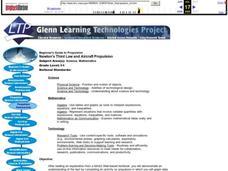
Newton's Third Law and Aircraft Propulsion
Students research propulsion, graph data, and interpret the results.
Curated OER
Lift/Velocity Relationship Problem Set
Students, after reading an explanation from a NASA Web-based textbook, demonstrate their ability to use, graph (using a graphing calculator), and interpret a text equation.
Curated OER
Mass & Velocity Effect
Students, after reading the explanation given below, use FoilSim to complete the activity to fulfill the specifications of a given airfoil and then plot and interpret graphs.
Curated OER
Lesson Plan On Fran Data
Seventh graders investigate the concept of functions and how they are used in the context of the real world while identifying the dependent and independent variables. They graph relations and functions and find the zeros of functions....
Curated OER
Environmental Mathematics
Eighth graders determine food that they would need to survive in the wild. They graph the best foods for their environments and rate the survivability rate for each member of their group.
Curated OER
The Cost of Life
Students research the salary for a career of interest. They consider what kind of lifestyle that career would provide and graph their information for comparison.
Curated OER
The Box Problem
Students investigate the concept of functions and how they are used with polynomials. They practice finding the zeros of functions and graph polynomial functions for the help of giving solutions. Students interpret the curve of a line...
Curated OER
Confusing Colors!
Fourth graders collect data, graph their data, and then make predictions based upon their findings. They's interest is maintained by the interesting way the data is collected. The data collection experiment is from the psychology work of...
Curated OER
An Apple A Day
Students create a graph that showcases their pick for favorite kind of apple. Students are given samples of a variety of apples to determine their favorite in a taste test. They a create a tally chart of favorite kinds apples and use a...
Curated OER
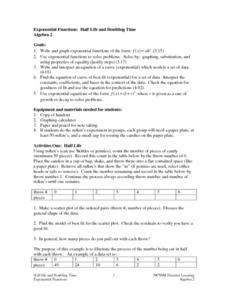
Exponential Functions: Half Life and Doubling Time
Students investigate the concept of exponential functions and how they increase in size over time. They simplify the functions in order to find the solutions that are possible and perform analysis of the curved line that is produced when...


