Curated OER
Double, Double: Looking at the Effect of Change on Perimeter, Area and Volume
Students explore perimeter, volume, and area. In this math lesson, students explore how changes in dimensions of geometric shapes affect the perimeter, area and volume of the various shapes. Students investigate the results when the...
Curated OER
Math: Party Time!
Twelfth graders discover how to calculate the total costs for a party. They determine the unit prices of food and supplies, the quantities needed, and complete a chart displaying their findings. Students calculate the costs per serving...
Curated OER
Not Everything is More Expensive
Students explore percent increases and decreases. They calculate the percent increase and decrease. Students use math to solve problems and communicate. They apply the given formula for percent increase/decrease.
Curated OER
Bats: Fact and Fiction
Learners describe the characteristics and behaviors of bats. After viewing a video, they explain how bats use echolocation to navigate and how they find their young within a group. They list four misconceptions about the animal and...
Curated OER
Introduction to Slope
Students distinguish between positive and negative slope. They calculate the slope of various lines. Students identify and generate perpendicular and parallel lines base on their slope.
Curated OER
Ohio Census 1990 and 2000
Students explore the Ohio census numbers in 1990 and 2000. In this social studies lesson, students use the census data to answer questions.
Curated OER
Drip, Drip, Drip or The Case of the Leaky Faucet
Learners explore the cost of wasted water. In this math lesson, students conduct an experiment in which they collect data on how much water is lost when a faucet leaks. Learners figure the cost of the water that was wasted.
Curated OER
Energy Choices
Students figure the best gas prices. In this math lesson, students add and multiply with decimals. Students complete a worksheet to find which supplier offers the best gas prices.
Curated OER
Estimation With Percents
Pupils examine percents. In this percents lesson, students will estimate percentages. Using advertisements from a newspaper, pupils problem solve to determine the final price of a sale item.
Curated OER
Party Time
Young scholars explore the cost of a party. In this math lesson, students plan a party and determine the cost of hosting a party. Young scholars use information from grocery stores to determine the unit cost of items for the party.
Curated OER
Make Your Own "Weather" Map
Learners create their own "weather" map using data from x-ray sources. They analyze and discuss why it is important to organize data in a fashion in which is easy to read. They compare and contrast different x-ray sources using a stellar...
Pennsylvania Department of Education
Alike and Different
Learners compare and contrast objects and are introduced to a Venn Diagram. In this alike and different lesson, students make observations regarding properties of objects. Learners classify object and build ideas about variables....
Curated OER
Code Breakers
Students collect data and make a frequency table, change ratios into percents, and analyze data to make predictions.
Curated OER
Circle the Earth - Explore Surface Types on a Journey around Earth
Students use CERES percent coverage surface data with a world map in locating landmasses and bodies of water at Earth's Equator.
Curated OER
Calculus
Students make an inquiry with the aid of technology into the concept of functions. The emphasis of the lesson is on the interplay between the geometric and analytic information.
Curated OER
Pythagorean Theorem
Students solve right triangles using the Pythagorean Theorem. In this solving right triangles using the Pythagorean Theorem instructional activity, students find the missing side of a right triangle. Students find the...
Curated OER
Calculating Range for a Constant Velocity
Students read an explanation from the NASA Web-based "textbook", The Beginner's Guide to Aerodynamics, then use the information in combination with data from other Web sites to solve single variable equations for distance (range), time,...
Curated OER
Pumped Up Gas Prices
Young scholars spend one month keeping track of the mileage and gasoline amounts they or their family has used. Information is entered into a spreadsheet to help calculate the average gas prices over time.
Pennsylvania Department of Education
Creating Polygons
Students describe, make and compare polygons. In this creating polygons lesson, students identify properties of quadrilaterals and describe common features of two dimensional shapes.
Curated OER
Perimeters, Patterns, and Conjectures
Learners discover patterns and write conjectures relating to perimeters and polygons. Working in cooperative learning groups, they use manipulatives and graphic organizers to solve problems then answer a series of questions in which they...
Curated OER
Wing Shapes and Areas
Students, after reading the explanation given below, use FoilSim to determine the weight of the aircraft that can be lifted by a pair of wings of each type. They also design a unique platform of a wing to lift a plane weighing 11500 pounds.
Curated OER
Geometry Scavenger Hunt
Students use the digital camera, identify geometric shapes (in nature as well as man-made), and gain a better understanding of geometric vocabulary. They search for and recognize geometric shapes in unusual settings
Curated OER
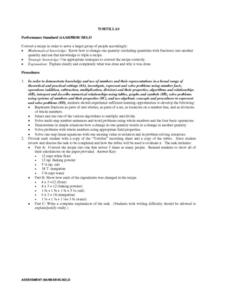
Tortillas
Students convert recipes for tortillas. They calculate the amounts of ingredients as they convert recipes and write an explanation of the task to demonstrate their calculations. After reviewing their calculations, they demonstrate how...
Curated OER
Energy Choices
Students add and multiply decimals to complete gas choice worksheets. They discover which gas supplier has the best gas prices. Students collect and interpret data about local natural gas suppliers and use this information...
