Curated OER
Move It
Studens collect and graph data. In this algebra instructional activity, students use a CBL and CBR with a TI Calcualtor to observe linear graphs. They use the correct vocabualry as they discuss the collected data.
Curated OER
Linear Functions-Learn Your Lines
Students solve and graph linear equations. In this algebra lesson, students collect and plot data on a coordinate plane. They use the CBL and TI calculator to graph systems of equation.
Curated OER
Guess the Age
Young scholars explore functions using real world application. In this algebra instructional activity, students play a game as they apply concepts of function. They graph their findings and discuss it with the class.
Curated OER
Relating Distance and Velocity Over Time
Students calculate the distance and velocity over time. In this algebra lesson, students graph a linear function to represent the distance vers time travel. They interpret their graphs and draw conclusion.
Curated OER
Collecting And Fitting Quadratic Data
Pupils investigate the concept of using quadratic data to plot coordinates on a plane. They also apply the quadratic formula for a variety of problems with the help of a graphing calculator to draw the parabola for given coordinates.
Curated OER
Guess the Age
Students rewrite word problems using symbols. In this algebra lesson, students rewrite equations graphically, algebraically and verbally. They relate the concepts to the real world.
Curated OER
Whose Line is it Anyway?
Students solve systems of equations. For this algebra lesson, students identify the domain and range of each function. They use the slope and y-intercept to graph each line.
Curated OER
What's The Point?
Students solve word problems using the correct math symbols. For this algebra lesson, students use the TI calculator to graph their equation and analyze it. They find the line of regression and use to draw conclusion.
Curated OER
Homecoming Tickets
Students solve word problems using systems of equation. In this algebra instructional activity, students use computer and graphing to graph and analyze their solution. They solve system involving inequalities.
Curated OER
The Absolute Truth
Young scholars solve problems of inequalities and equations. For this algebra lesson, students add, subtract, multiply and divide to solve inequalities. They graph their solutions on a number line.
Curated OER
Putting Your Money to Work
Young scholars create a collect data on expenses. In this algebra instructional activity, students create a spreadsheet to solve scientific equations. They incorporate math, science and technology in this instructional activity.
Curated OER
Slip Slide'n Away
Young scholars analyze the sliding of boxes along a warehouse floor. In this algebra lesson, students connect math and physics by calculating the friction created by the sliding of each box. They develop faster method to move the box,...
Curated OER
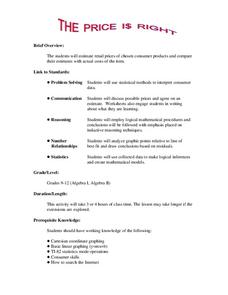
The Price Is Right
Students create a list of products with estimated prices. In this algebra lesson, students learn to write equations using variables. They match their created list with that of actual products and compare their prices,
Curated OER
Beginning Modeling for Linear and Quadratic Data
Students create models to represent both linear and quadratic equations. For this algebra lesson, students collect data from the real world and analyze it. They graph and differentiate between the two types.
Curated OER
Slippery Slope
Students define patterns, relation and function. In this algebra lesson, students find the slope of a line and write equations of line. They model the slope using real life scenarios.
Curated OER
The Box Problem
Young scholars create graphic, algebraic and verbal ideas of functions. In this algebra lesson, students graph functions and identify the zeros of the functions. They find the domain and range and classify functions as relation or not.
Curated OER
Exponential and Exponents Functions
Students solve problems using exponential properties. In this algebra instructional activity, students differentiate between exponents, exponential and log functions. They graph their functions using table and exponents.
Curated OER
Slopey Math
Students identify the slope of a line and use it to solve real life problems. In this algebra lesson, students write linear equations in slope intercept form and make a correlation to its relation to the real world. They use the slope an...
Curated OER
Modeling Population Growth
Learners collect data on population growth. In this statistics lesson, students graph their data and make predictions. They find the linear regression and the best fit line.
Curated OER
How Sharp Is Your Memory?
Students play a memory game as they explore reasoning. In this algebra instructional activity, students identify concepts using pictures and words. They model real life scenarios using hands on manipulatives.
Curated OER
The Fuelish Fact Finding
Pupils define fluctuation and the price of food. In this algebra lesson, students create a budget to live on based on their living expenses. They create a chart and explore the cause and effect of real life scenarios.
Curated OER
The Fat and the Lean
Students collect data on calorie intake. In this algebra activity, students use the collection of data to make better eating decisions. They investigate the nutritional value in food using a graph and draw conclusion from their findings.
Curated OER
Maps and Modes, Finding a Mean Home on the Range
Fifth graders investigate data from maps to solve problems. In this data lesson, 5th graders study maps and collect data from each map. Students present their data in a variety of ways and calculate the mode, mean, median, and range.
Inside Mathematics
Expressions
Strive to think outside of the quadrilateral parallelogram. Worksheet includes two problems applying prior knowledge of area and perimeter to parallelograms and trapezoids. The focus is on finding and utilizing the proper formula and...


