Curated OER
Linear Patterns in Data
Eighth graders extend their learning of graphing linear equations and are introduced to connecting patterns in tables and graphs to represent algebraic representations. They then determine patterns and extrapolate information from these...
Curated OER
Interpreting Data
For this interpreting data worksheet, students solve and complete 4 different types of problems using different data types. First, they collect raw data from a paragraph shown. Then, students identify the examples of two different types...
Curated OER
Linear Systems
Students solve and graph linear equations. In this algebra lesson, students solve systems of equations using elimination and substitution. They graph their answer and identify the point of intersection.
Curated OER
Word Problems
Students solve word problems using mathematical symbols. In this algebra lesson, students collect data and analyze it. They analyze the data using a table or graph after plotting the data.
Curated OER
Relating Distance and Velocity Over Time
Students calculate the distance and velocity over time. In this algebra lesson, students graph a linear function to represent the distance vers time travel. They interpret their graphs and draw conclusion.
Curated OER
Race The Rapper: Slopes
Students calculate the slope of the equation In this algebra instructional activity, students graph coordinate pairs of linear equations and identify the relationship between x and y values and slope. They differentiate between...
Curated OER
Slippery Slope
Students define patterns, relation and function. In this algebra lesson, students find the slope of a line and write equations of line. They model the slope using real life scenarios.
Curated OER
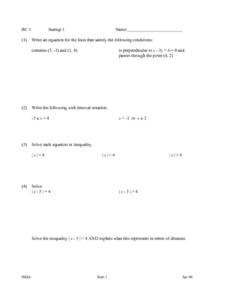
Startup 1: Functions & Interval Notation
In this function worksheet, pupils write an equation of a line. They solve inequalities and write functions with interval notation. This two-page worksheet contains approximately 20 problems.
Curated OER
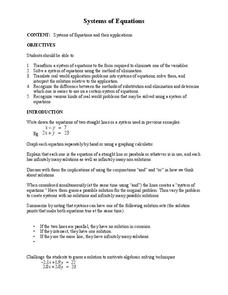
Systems of Equations
Students solve systems of equations. In this algebra instructional activity, students use elimination and substitution to solve for the point of intersection. They use graphing to see where the two lines intersect.
Curated OER
Spaghetti Bridges
Eighth graders experiment with building bridges of spaghetti, pennies, and a cup to determine how varying the number of spagetti pieces affects the strength of the bridge. They graph their results and interpret the data.
Curated OER
Choosing a Summer Job
What did you do over your summer vacation. Young wage earners must compare summer job options, and determine when each job earn the same amount and what that amount be. This be done by creating, graphing, and solving systems of...
Curated OER
Determination of Tensile Stress-Strain Common Properties in Materials
Young scholars demonstrate the relationship between stress and strain, then graph stress-strain curves for various common materials. Students interpret graphed results and discuss differences in mechanical properties of materials.
Curated OER
Mapping a Temperature Field
Young scholars measure and graph temperatures. In this temperature field instructional activity students use a map to measure and plot field values and construct isolines and interpret the results.
Curated OER
Real World Systems of Linear Equations
Students solve systems of equations with fluency. In this algebra lesson, students graph, use elimination and substitution to solve systems of equations. They identify the point of intersection using algebra.
Curated OER
How Much Will I Spend On Gas?
Students construct a linear graph. In this graphing lesson, students determine a monthly budget for gasoline. Students construct a t-chart and coordinate graph to display data. Resources are provided.
Curated OER
Data Collection and Presentation
Students concentrate on discrete quantiative data. They are shown that the vertical line diagram as a more appropriate way to present discrete quantiative data then bar charts. Students work as a group to help with the interpretation...
Curated OER
The Absolute Truth
Students solve problems of inequalities and equations. For this algebra lesson, students add, subtract, multiply and divide to solve inequalities. They graph their solutions on a number line.
Curated OER
Beginning Modeling for Linear and Quadratic Data
Students create models to represent both linear and quadratic equations. In this algebra lesson, students collect data from the real world and analyze it. They graph and differentiate between the two types.
Curated OER
Integrated Social Studies and Math Lesson
Fourth graders study the American Civil War. They read and analyze information regarding the casualties of the Civil War, fucusing on Indiana soldiers. They graph the information and then write in their reflective journals responding...
Curated OER
Jelly Belly: What a Wonderful "Bean"!
Students explore how jelly beans are produced. They discuss the origins of the jelly bean and view a video about how jelly beans are prepared, tested, shaped, finished, and shipped and estimate the amount of jelly beans in a jar and sort...
Curated OER
Cartesian Coordinate System
Students explore the Cartesian coordinate plane and plot points on the graph. They interpret coordinates for a point from the graph and give the ratio of rise over run for slope.
Curated OER
Using Inequalities to Problem Solve
Learners explore inequalities. In this Algebra I lesson, students solve and graph linear inequalities involving addition, subtraction, multiplication, or division. Learners use inequalities to solve and graph real-world problems.
Curated OER
Algebra II: Quadratic Functions
Students collect and organize data, make a scatterplot, fit a curve to the appropriate parent function, and interpret the results. Students translate among the various representations of the quadratic function, formulate equations, use a...
Curated OER
Forces and Motion-The Downhill Racer
Students calculate a toy car's velocity and acceleration. In this force and motion lesson, students build ramps and attach a dropper to a toy car, which is released down the ramp. Students calculate and graph velocity and acceleration...


