Curated OER
Module 7 Revision Guide - Chemistry
Two versions of this handout are provided, the second with more detailed information on the same topics. Chemistry aces survey chemical reactions, heat energy transferred, and the action of enzymes by reading this resource. You can...
Teach Engineering
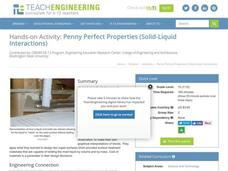
Penny Perfect Properties (Solid-Liquid Interations)
I can get more water to stay on a penny than you can! Collaborative pairs determine the volume of liquids that can be contained on the surface of copper pennies and plastic coins. The pairs analyze their results using graphs and go on to...
Curated OER
No Title
Sixth graders, after reviewing and studying the basics of recording, analyzing and presenting data, create on graph paper a bar or line graph to represent given data and then interpret the data. They answer questions about the given data...
Curated OER
Investigating Motion, Forces, and Energy Lab Book
Eighth graders create their own experiements using toy trucks, cars or balls to measure the time it takes two of them to travel 5 meters, as well as at each 1 meter interval. They make use computers to make a time/distance graph and...
Curated OER
McCadam's Quarterly Report
Fourth graders problem solve a problem from a local business using data, generating graphs, and draw conclusions. They submit their findings in a business letter format with feed back from a company's plant manager.
Curated OER
Velocity vs. Time
Twelfth graders read and interpret v-t graphs. After studying velocity and time, 12th graders read graphs to calculate the acceleration of a moving body and determine the distance and displacement of a body. Students explore the...
Curated OER
Ocean Botttom Profile
Students interpret a graph of ocean depths and topographic features. This task assesses students' abilities to interpret figures, organize and represent data, apply knowledge of scale to a profile, and apply theoretical knowledge.
Curated OER
Mountain of Ice
Pupils graph and analyze chemical concentrations from ice core data. In small groups they prepare their graphs using colored pencils, and discuss the results.
Curated OER
Between The Extremes
Students analyze graphs for specific properties. In this algebra lesson, students solve equations and graph using the TI calculator. They find the different changes that occur in each graph,including maximum and minimum.
Curated OER
What Color is Your Air Today?
Students investigate air quality. They analyze Air Quality Index data tables, interpret the graphs, complete a worksheet, and discuss trends in air quality.
Curated OER
Finding an Earthquake's Epicenter
Students examine the process used to identify the epicenter of an earthquake. They identify the Richter scale and interpret a seismograph reading. They also view photographs of the aftermath of earthquakes.
Curated OER
Activity #3 Finding Mass
Students use graph paper to construct a graph and determine the slope of a straight line. They determine the weight (mass) of paper clips with a pan balance. Pupils weigh an unknown number of paper clips, and to interpret the graph to...
Curated OER
Weather v. Climate
Ninth graders discuss the differences between climate and weather as a class. Using data they collected, they create a graph of the data to share with the class over a specific time period. They compare and contrast this data with...
Curated OER
Snow Cover By Latitude
Students create graphs comparing the amount of snow cover along selected latitudes using data sets from a NASA website. They create a spreadsheet and a bar graph on the computer, and analyze the data.
Curated OER
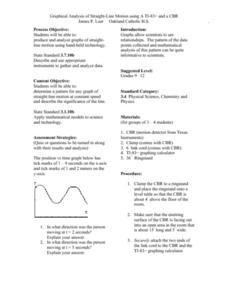
Graphical Analysis of Straight-Line Motion
Students investigate the concept of straight line motion. They determine the pattern and graph it looking for the motion maintained at a constant speed. Students also write a description of the significance of the line. The skill of...
Curated OER
Down the Drain
Students explore what problems might occur if oxygen decreases in a body of water. They model what happens in a situation where decomposition is occurring. Students obtain, organize, graph, and interpret information. They i interpret...
Curated OER
Mapping a Temperature Field
Students measure and graph temperatures. In this temperature field lesson students use a map to measure and plot field values and construct isolines and interpret the results.
Curated OER
Amazon Rainforest: You Won't Find George in This Jungle
Students identify locations of rainforests, compare/contrast layers of the rainforest, construct and interpret maps and graphs, recognize relationships between man and the environment, and write about an imaginary walk in the rainforest.
Curated OER
Electromagnets: Winding Things Up!
Students explore solenoids and electromagnets. After building an electromagnet, students use a TI Graphing calculator, a CBL 2 interface and a magnetic field sensor to measure the strength of a magnetic field. They create a graph of...
Curated OER
SURVIVING A COSMIC INVASION
Young scholars read periodicals relating to radioacitivity and interpret a Geiger Counter. They work in small groups, share information and help each other explain the Geiger Counter. They discover the relationship distance to...
Curated OER
Water Usage and Conservation
Students investigate water usage at school and at home. They use graphs and tables to evaluate water usage. Students describe possible water conservation measures. They use graphs and tables to relate data as part of a written report.
Curated OER
Active Wear
Middle schoolers interpret and analyze data. In this middle school mathematics lesson plan, students conduct an experiment in which they investigate which solar collector, black, white, or silver, absorbs the most heat. ...
Curated OER
Forces and Motion-The Downhill Racer
Students calculate a toy car's velocity and acceleration. For this force and motion lesson, students build ramps and attach a dropper to a toy car, which is released down the ramp. Students calculate and graph velocity and acceleration...
Curated OER
$$$eaweed
Students compare and evaluate the world's different seaweeds. In this investigative instructional activity students study seaweed and the harvesting of it. They then interpret the data collected and graph the seaweed...

