Curated OER
Properties of Parabolas
Have your learners investigate parabolas. In this Algebra II lesson plan, students explore the basic definition of a parabola by using Cabri Jr. to create a parabola given the focus and directrix. Students interpret the equation...
Curated OER
Guess the Ages
Learners explore scatter plots in this algebra lesson. They create a scatter plot from their guesses regarding a famous person’s birth date and the actual birth date then they examine and interpret the results of their graph.
Curated OER
Linear Motion 2
For this linear motion worksheet, students answer 12 questions about displacement, velocity, and acceleration. They solve problems for acceleration, displacement and velocity and show the equations they used to find the solutions. They...
Curated OER
Velocity
In this velocity worksheet, students solve 13 problems including finding acceleration of objects, forces on objects, velocity of objects and interpreting graphs of position vs. time.
Curated OER
Collecting and Analyzing Data
In this collecting and analyzing data worksheet, students collect data from an experimental investigation about the relationship between the color of a Tootsie Roll Pop and the time it takes to get to the chocolate center. ...
Virginia Department of Education
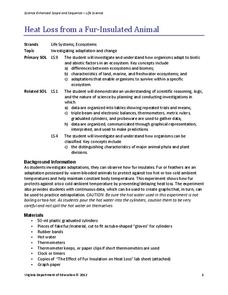
Heat Loss from a Fur-Insulated Animal
How do animals adapt to weather changes? Provide your class with the ability to understand adaptations and body temperature as they participate in this hands on experiment, using fake fur and hot water. Pupils collect data and...
Virginia Department of Education
Mineral Identification
What's the difference between a rock and a mineral? And what properties are used to identify minerals? The first installment of a five-part series on earth materials and processes prompts young scientists to identify a set of...
Virginia Department of Education
Solar System Model
How many planets can you name? Did you get all 13 in our solar system, including the dwarf planets, or were you surprised when you read there are 13 planets? The lesson helps scholars understand the scale of the universe including the...
Virginia Department of Education
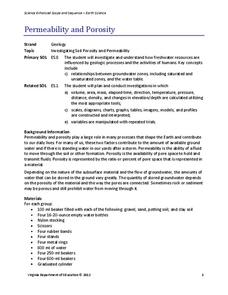
Permeability and Porosity
Covering both permeability and porosity, scholars perform a hands-on experiment testing various soil types. The material includes a pre-lesson worksheet to help focus pupils on the task at hand.
Virginia Department of Education
Adaptation and Evolution
Um may be the atomic symbol for confusion, but it won't be needed in this lesson. Scholars rotate through seven stations completing experiments, hands-on activities, writing exercises, and analysis. Stations include material on...
Texas Education Agency (TEA)
Gaining Understanding and Information from Introductory Material, Headings, and Other Division Markers in Texts (English III Reading)
All teachers are teachers of reading! The 13-part interactive series ends with a lesson that teaches learners (and their instructors) how to approach reading their textbooks. After learning about several strategies, users test their...
Curated OER
Watershed Investigations
Students find maps of the region to show rock formations and soil types and use GIS to compare radon levels. They describe three types of radioactive decay, interpret graphs, and follow steps to develop a nuclear bomb or energy.
Curated OER
Our Desert Backyard
Students make observations of their own backyard. In this environment activity, students keep records of the plants and animals they see in their home or school yard. Students make notes of how the weather and environment changes over...
Curated OER
Favorite Animal at the Zoo - Making a Pie Chart
In this graphing and interpretation worksheet set, students draw charts that are either blank or outlined that show information about students' favorite zoo animals. They answer questions based on the data in 15 examples.
Curated OER
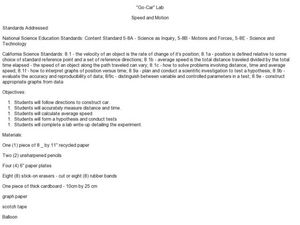
"Go-Car" Lab
Students construct a car based on directions given. In this physics lesson, students calculate average speed using distance and time information. They collect data and create a graph of distance vs. time.
Curated OER
What are Igneous Rocks and How are They Formed?
Crystals form before your very eyes! What sixth grader wouldn't enjoy this lesson on igneous rock formation? Using hot Salol, junior geologists observe the crystal formation process as the material cools. This comprehensive lesson plan...
Curated OER
Solar Heating in the Himalayas
A fascinating lesson plan on how solar power is utilized by people who live in the Himalayas is here for you. In it, learners perform a case study which will help them understand that solar energy is a renewable resource, that geography...
Curated OER
Investigating Brass Instruments and Pitch
Students observe the sounds of different brass instruments in order to understand how to create different pitches. In this musical instructional activity, students create a "brass" instrument from everyday household objects. The students...
Curated OER
Dental Detectives
First graders explore the theme of dental health and hygeine. They make tooth loss predictions, count lost teeth, and graph tooth loss. In addition, they listen to dental health stories, read online stories, create spreadsheets, and play...
Alabama Learning Exchange
Human Slope
Middle and high schoolers explore the concept of slope. In this slope lesson, learners graph lines using a life-size graph. They use chalk on a blacktop to create a coordinate plane and use each other as the tick marks on the grid....
Curated OER
Systems of Equations: What Method Do You Prefer?
Students explore the concept of solving systems of equations. For this solving systems of equations lesson, students watch YouTube videos about how to solve systems by graphing and by elimination. Students use an interactive website to...
Teach Engineering
Preconditioning Balloons: Viscoelastic Biomedical Experiments
What does stretching a balloon have to do with equilibrium? Groups explore preconditioning by stretching a balloon to a point of equilibrium. They then measure the amount of force required to stretch the balloon to the same point several...
Curated OER
What Factors Contribute In Attracting Birds To Feeders?
Students develop their own research questions dealing with specific variables provided by the instructor; students conduct bird counts using two kinds of birdseed, and analyze possible effects such as abundance or diversity.
Tech Museum of Innovation
Analogous Models
What goes into a museum display? A secondary-level STEM project prompts groups to design a museum display for the Tech Museum of Innovation. They create an analogous, interactive model illustrating a science concept to complete the...


