Curated OER
Weather Maps
Students interpret information on a weather map in order to construct a graph, and discuss how the weather impacts their lives.
Curated OER
Outbreak!
Eleventh graders explore the spread of a disease through a population. In this Algebra II lesson, 11th graders analyze graphical data representing they spread of a disease. Students produce a graph of the virus data,...
Curated OER
COLD SEA WATERS
Students examine how old sea waters affected the local and state area during the summer of 1998. Studying a detailed web-site helps students examine sea temperatures.
Curated OER
Measuring Velocity
Learners calculate their classmate's velocity using a mathematical formula. In this physics lesson, students graph the motion. They interpret the slope of the graph.
Curated OER
Groundwater Pump Test
Students observe groundwater flowing to a pump, changes in groundwater table as a result of pumping, and the quantity and quality of water in the groundwater system. Students must graph and interpret their data, and quantify orders of...
Curated OER
How Mass Affects the Speed of a Coaster Car
Learners determine what factors affect the speed of the car. In this physics instructional activity, students calculate speed, velocity and acceleration from experimental data. They construct and interpret motion graphs.
Curated OER
Dental Impressions
What an impressive task it is to make dental impressions! Pupils learn how dentists use proportional reasoning, unit conversions, and systems of equations to estimate the materials needed to make stone models of dental impressions....
Achieve
Ivy Smith Grows Up
Babies grow at an incredible rate! Demonstrate how to model growth using a linear function. Learners build the function from two data points, and then use the function to make predictions.
Noyce Foundation
Ducklings
The class gets their mean and median all in a row with an assessment task that uses a population of ducklings to work with data displays and measures of central tendency. Pupils create a frequency chart and calculate the mean and median....
Intel
Energy Innovations
Collaborative groups examine the importance of energy resources on quality of life by researching different energy sources and alternative energy sources through data analysis. They make a comparison of different countries and cultures,...
Statistics Education Web
Double Stuffed?
True or false — Double Stuf Oreos always contain twice as much cream as regular Oreos. Scholars first measure the masses of the filling in regular Oreos and Double Stuf Oreos to generate a class set of data. They use hypothesis testing...
Statistics Education Web
Are Female Hurricanes Deadlier than Male Hurricanes?
The battle of the sexes? Scholars first examine data on hurricane-related deaths and create graphical displays. They then use the data and displays to consider whether hurricanes with female names result in more deaths than hurricanes...
Blake Education
Harry Potter and the Philosopher’s Stone
The motto for Hogwarts School of Witchcraft and Wizardry warns that one should never tickle a sleeping dragon, but learners will definitely be tickled by the activities in a packet of materials designed to accompany a reading of the...
Mathematics Vision Project
Quadratic Functions
Inquiry-based learning and investigations form the basis of a deep understanding of quadratic functions in a very thorough unit plan. Learners develop recursive and closed methods for representing real-life situations,...
Statistics Education Web
How Wet is the Earth?
Water, water, everywhere? Each pupil first uses an Internet program to select 50 random points on Earth to determine the proportion of its surface covered with water. The class then combines data to determine a more accurate estimate.
Curated OER
Whose Line is it Anyway?
Students solve systems of equations. For this algebra lesson, students identify the domain and range of each function. They use the slope and y-intercept to graph each line.
Curated OER
Energy Concepts - Lesson Plan
Young scholars state the different forms of energy; and observe the effects of energy changing from one form to another (other forms) in electrical appliances.
Curated OER
An Egg-cellent Osmosis Experiment
Students investigate the problem of osmosis by conducting an experiment. They use eggs with the shells dissolved to tell whether fluid can move across the membranes. The experiment provides high interest for all kinds of students to keep...
Curated OER
A Geological Puzzle
Students compare and contrast the various types of rocks on each continent. In groups, the calculate the rock ages and types to determine if the continents, in their opinion, were joined at one time. They develop two imaginary...
Curated OER
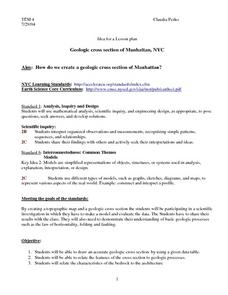
Geologic cross section of Manhattan, NYC
Learners draw an accurate geologic cross section by using a given data table. They relate the features of the cross section to geologic processes. Students then relate the characteristics of the bedrock to the architecture.
Curated OER
Ziplock Chemistry
Students investigate various chemical reactions when creating mixtures in ziplock baggies. In this chemistry lesson, students will recognize various chemical reactions and cite evidence. Safety and assessment strategies are included in...
Curated OER
Our Watershed
Students work with the Tribal Council and Elders to explain the historical importance of the area's watershed. They develop a model of the watershed and map the route of water flow from the watershed to the ocean.
Curated OER
Water Pressure Experiments
Students perform experiments measuring water pressure. They record their observations after poking holes in plastic bottles filled with water with the lids on and then off. They discover the role gravity plays in the water flow.
Curated OER
My Car Has Potential
Seventh graders investigate how changes in the mass or height of a ramp can affect the change in potential energy. They discuss the concepts of work and energy, then using the four question strategy, they design an experiment that...


