Curated OER
What Causes the Seasons?
Students conduct experiment to examine how tilt of globe influences warming caused by lighted bulb. They monitor simulated warming of their city by sun in winter and in summer by using light bulb, interpret results, and submit lab report.
Curated OER
Insect Monitoring
Students participate in an interactive activity using the scientific method to study biodiversity. In this insect monitoring activity, students simulate the layers of soil and the insects that would live there. Students design...
Curated OER
HW Unit 10:2-Harmonic Motion
In this harmonic motion worksheet, students answer 9 questions about pendulums, a slinky and characteristics of harmonic motion. They identify the changes in waves as the amplitude gets bigger and interpret a graph of position vs. time.
Curated OER
Falling Objects
High schoolers examine the velocities of two different falling objects. They produce distance vs. time and velocity vs. time graphs using a Motion Detector and a CBL 2 to collect experimental data. Learners analyze and interpret the...
Curated OER
Fertilizers, Pesticides and Human Health
Students define several vocabulary terms related to chemicals and toxicology. Students calculate chemical concentrations in water and explain the toxicological principles that govern safety of substances. Students conduct an...
Curated OER
Illuminating Climate Change: Connecting Lighting and Global Warming
Students analyze energy usage and connect energy usage to fossil fuel consumption. In this global warming and pollution lesson, students what fuels are used to generate electricity and how much CO2 each fuel produces, then graph the...
Curated OER
Making Connections-Review Experimental Design and Homeostasis
For this experimental design and homeostasis worksheet, students complete 20 sentences with key terms about designing experiments, gathering data, graphing data and determining controls. They also complete sentences about homeostasis and...
Curated OER
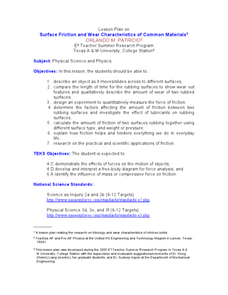
Surface Friction and Wear Characteristics of Common Materials
High schoolers identify the factors affecting friction. In this physics lesson, students construct their own rocket car and race them. They graph the average speeds and discuss how lubricants affect friction between rubbing surfaces.
Curated OER
Illustrate the Constellations
Students explore space science by participating in a star identification activity. In this astronomy lesson, students identify different star patterns and discuss the movement of stars across the sky as the seasons change. Students...
Curated OER
The Sun Affects Earth
Third graders read, write, and listen to information about the sun and its effects on the Earth.as it relates to its axis, orbit, rotate, and revolution. In this solar system lesson, 3rd graders examine how the sun...
Curated OER
Comparing Data
Eighth graders create a survey, gather data and describe the data using measures of central tendency (mean, median and mode) and spread (range, quartiles, and interquartile range). Students use these measures to interpret, compare and...
Curated OER
Mixed Frequency Signals
In this electrical worksheet, learners interpret schematics to answer a series of 31 questions about mixed frequency signals. This worksheet is printable and the answers are available on-line.
Curated OER
How the Environment Affects Our Health
Ninth graders explore how the environment affects health. In this infectious disease lesson, 9th graders investigate what environmental situations cause infections diseases. Students study the symptoms, treatments, prevention, and...
Curated OER
Chances Are
Upper graders examine the concept of probability. They collect data and create a bar graph. They must interpret the data as well. Everyone engages in hands-on games and activities which lead them to predict possible outcomes for a...
Curated OER
Mass & Velocity Effect
Students, after reading the explanation given below, use FoilSim to complete the activity to fulfill the specifications of a given airfoil and then plot and interpret graphs.
Curated OER
Wing Specifications
Ninth graders use FoilSim to fulfill the specifications of a given airfoil (wing) and plot and interpret graphs.
Curated OER
Quarter, Nickel, Dime....
An engaging game called, "Quarter, Nickel, and Dime" is presented in this math lesson. Players are given an envelope with slips of paper that represent the three coins. In pairs, they play the game 18 times, and the whole class charts...
California Academy of Science
How Big is Big?
In a math or life science class, "mini-me" models are created with cardstock to reflect a 1:10 scale of students' bodies. Learners measure each others' heights with meter sticks, and then reduce the size by 10. After this exercise, they...
Curated OER
Instantaneous Rate of Change of a Function
Pupils draw the graph of a door opening and closing over time. They graph a given function on their calculators, create a table of values and interpret the results by telling if the door is opening or closing and evaluate the average...
Curated OER
Properties of Parabolas
Learn to identify the properties of parabolas. Learners define parabola as the locus of all points equidistant from a fixed point and a fixed line. Also, interpret the equation for a parabola in vertex form and gain a visual...
Curated OER
Properties of Parabolas
Have your learners investigate parabolas. In this Algebra II lesson plan, students explore the basic definition of a parabola by using Cabri Jr. to create a parabola given the focus and directrix. Students interpret the equation...
Curated OER
Guess the Ages
Learners explore scatter plots in this algebra lesson. They create a scatter plot from their guesses regarding a famous person’s birth date and the actual birth date then they examine and interpret the results of their graph.
Curated OER
Linear Motion 2
For this linear motion worksheet, students answer 12 questions about displacement, velocity, and acceleration. They solve problems for acceleration, displacement and velocity and show the equations they used to find the solutions. They...
Curated OER
Velocity
In this velocity worksheet, students solve 13 problems including finding acceleration of objects, forces on objects, velocity of objects and interpreting graphs of position vs. time.


