Georgetown University
Cup-Activity: Writing Equations From Data
Determine how cup stacking relates to linear equations. Pupils stack cups and record the heights. Using the data collected, learners develop a linear equation that models the height. The scholars then interpret the slope and the...
Curated OER
Excel temperature Graphs
Students gather data about the weather in Nome, Alaska. For this Nome Temperature lesson, students create an excel graph to explore the weather trends in Nome. Students will find the average weather and add a trend line to their...
Curated OER
Chocolate Preferences Voting and Graphing Techniques
Students practice sampling and graphing techniques. In this data collection and interpretation lesson, students write and conduct surveys about chocolate preferences and then collect their data. Students graph the data in order to...
Curated OER
Storybook Character Graph
First graders dress as their favorite storybook character. They draw a self-portrait, then place the drawing on a graph.
Curated OER
Data Comparison And Interpretation: North Korea, South Korea, And the United States
Ninth graders brainstorm "what they know about North Korea and South Korea." They determine the approximate distance from the United States to North and South Korea and create a graph comparing the birth rates, death rates, infant...
Curated OER
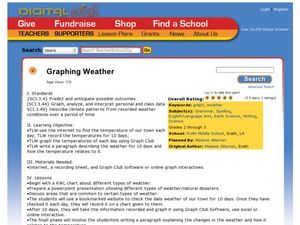
Graphing Weather
Students make a graph. In this weather lesson, students fill in a KWL chart about different types of weather. Students watch a PowerPoint presentation about weather and natural disasters and where these types of weather are common....
Curated OER
Graphing Applications
In this graphing applications worksheet, students derive equations for 4 word problems. Students then define variables, find intercepts, graph the equations, and interpret the slopes.
Curated OER
Forces and Graphing
Students analyze graphs to determine relationships between variables and rates of change. They determine the basic concepts about static reaction forces. They determine the slope and equation of a line.
Curated OER
Farm Stories, Animal Webbing, Favorite Farm Animal Graph
Students brainstorm animals they would expect to see on a farm. They save these on a Kidspiration web. Students watch or read a farm story. They discuss the characters. Students vote for their favorite farm animal and crate a graph using...
Curated OER
Graphing Linear Motion
In this graphing linear motion worksheet, students answer 20 questions about velocity of objects, the distance they travel and the time. They interpret a graph of position vs. time and identify the velocity at certain point on the graph.
Curated OER
Monopoly Graphs
Students relate the concepts of linear functions to the game of monopoly. In this algebra lesson, students solve problems with ratio and proportion. They collect data and graph it.
Curated OER
Zebra Mussel Population Simulation
Students are taught how to format and enter data into an Excel spreadsheet. They make a graph, and interpret graphed data. Students discuss the possible impacts of zebra mussels on the Hudson river. They graph zebra mussel data.
Curated OER
Creating Bar Graphs and Pie Graphs
Second graders observe a demonstration of the creation of a bar graph and a pie graph of their favorite colors. They gather information about various topics from their classmates, then organize the information, creating a bar and a pie...
Curated OER
Mathematical Techniques - Basic Graphing
Students are introduced to significant figures and how to add, subtract, multiply and divide them. In a group, they practice plotting data points from a table to a graph and labeling all axes. They calculate the slope and y-intercept and...
Curated OER
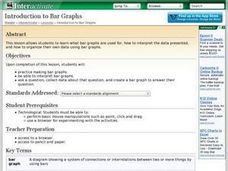
Introduction to Bar Graphs Lesson Plan
Students organize and interpret data using bar graphs.
Curated OER
Investigating: Interpreting Graphs and Analyzing Data
Students explore statistics by researching class birthday data. In this data analysis lesson plan, students investigate the different birthdays among their classmates and create data tables based on the given information. Students view...
Curated OER
Usage and Interpretation of Graphs
Learners review graphing and use processing skills to solve problems.
Curated OER
Pictograph to Bar Graph
Second graders explore organizing data to make it useful for interpreting picture graphs and bar graphs. They use Graphers software to create a pictograph and a bar graph.
Curated OER
Fast Food Survey Using Bar Graphs
Second graders conduct survey and sort data according to categories, construct bar graph with intervals of 1, and write a few sentences about their graphs.
Curated OER
Reading a Graph: Azimuth Range vs. Day in Barrow Alaska
Students practice reading a graph while doing story problems. They determine the x and y intercepts and calculate the slope. They also practice writing linear equations.
Curated OER
Getting Graphs: Researching Genealogy-A Piece of Pie
Third graders research their genealogy. In this math lesson, 3rd graders collect data and create graphs and charts. A presentation of their findings is given.
Curated OER
Bar Graphs Using M & Ms
Fifth graders observe an overhead of a graph on which M & Ms have been poured out. A volunteer comes up and separates the colors writing on the overhead how many there were of each color and another person labels the graph's title....
Curated OER
Creating Bar Graphs
Fifth graders design and label a bar graph using data taken from a class survey. They observe a teacher-led lecture, write and conduct their survey, and create a bar graph that includes identification of the minimum, maximum, mode,...
Curated OER
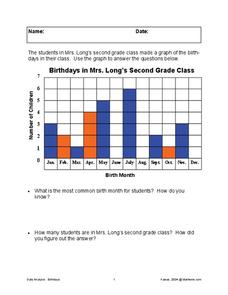
Birthday Graph
In this graphing worksheet, students interpret a graph of "birthdays in Mrs. Long's second grade class" to answer 2 related questions.
Other popular searches
- Interpret Graphs and Charts
- Read and Interpret Graphs
- Graphs Interpret
- Interpret Graphs Science
- Interpret Graphs and Data
- Use and Interpret Graphs
- Interpret Graphs and Science
- Algebra Interpret Graphs
- Graphs Interpret Plot


