Curated OER
1st Grade - Act. 03: T-Shirt Glyph
First graders create glyphs (symbols or icons) which represents them, and read the glyphs of others using a legend to explain the data on the glyphs.
Curated OER
POWER OF VOTING
Fifth graders explain the process of a national presidential election by researching through the Internet and holding an election simulation. They collect, graph, and interpret election data. They enhance their computer skills by...
Curated OER
Outbreak!
Eleventh graders explore the spread of a disease through a population. In this Algebra II instructional activity, 11th graders analyze graphical data representing they spread of a disease. Students produce a graph of the virus data,...
Curated OER
The Stock Market-Tracking and Picking Stocks
Students interpret the stock market. They pick preferable stocks based on price to earnings ratios listed in the quotes. They practice using fractions and decimals to calculate the cost of selling and buying various stocks using...
Curated OER
Using the Very, Very Simple Climate Model in the Classroom
Learners study the relationship between the average global temperature and carbon dioxide emissions. For this weather lesson students develop a test scenario using a model then read and interpret graphs of data.
Curated OER
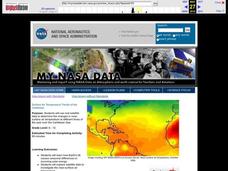
Surface Air Temperature Trends of the Caribbean
Students investigate the seasonal changes to sea surface and near-surface air temperatures near the equator. They use actual satellite data to track and graph the differences in air and sea temperatures during different seasons in the...
Curated OER
Collect the Weather Lesson Plan
Students explore the weather. In this weather spreadsheet lesson, students keep track of weather patterns as they use instruments and resources to chart the data the collect in spreadsheet form.
Curated OER
The Box Problem
Students create graphic, algebraic and verbal ideas of functions. In this algebra lesson, students graph functions and identify the zeros of the functions. They find the domain and range and classify functions as relation or not.
Curated OER
How Do You Feel Today?
Pupils create a graph, then listen to Dr. Seuss' book, My Many Colored Days. After the story, they do a similar graph and then compare the two graphs.
Curated OER
SURVIVING A COSMIC INVASION
Students read periodicals relating to radioacitivity and interpret a Geiger Counter. They work in small groups, share information and help each other explain the Geiger Counter. They discover the relationship distance to...
Curated OER
Algebra II: Quadratic Functions
High schoolers collect and organize data, make a scatterplot, fit a curve to the appropriate parent function, and interpret the results. Students translate among the various representations of the quadratic function, formulate equations,...
Curated OER
Trends of Snow Cover and Temperature in Alaska
Students compare NASA satellite data observations with student surface measurements of snow cover and temperature. They practice data collection, data correlations, and making scientific predictions.
Curated OER
Chrysanthemum and Letter Tiles
Students listen as the teacher reads Chrysanthemum. They discuss the story, focusing on the length of Chrysanthemum's name. They compare the lengths of their own names using letter tiles, grid paper, and a class graph.
Curated OER
Building a Pill Bug Palace
Students make "pets" of isopods (potato bugs) to determine their preferred environment and food sources. They record their results on a bar graph and in a scientific report.
Curated OER
If You're Under Pressure, Blame It On The Air Force
Students complete an experiment in which they demonstrate that air exerts a force. In groups, they create their own siphon and define air pressure. They estimate the time it might take to siphon various amounts of water. They collect,...
Curated OER
Integrated Social Studies and Math Lesson
Fourth graders study the American Civil War. They read and analyze information regarding the casualties of the Civil War, fucusing on Indiana soldiers. They graph the information and then write in their reflective journals responding...
Curated OER
Earthquakes
Eighth graders demonstrate the mathematical components of a scientific problem as well as illustrate how real world problems can be solved using math. They demonstrate math skills such as rate calculation, graphing, and linear equations.
Curated OER
Doing The School Run
Young scholars explore finding the percent of a numbers. They survey their peers to determine modes of transportation used in getting to school. Afterward, students organize information and create graphs and charts. They explore...
Curated OER
The First Nations, Métis, and Inuit Peoples of Canada
Young scholars explore demographic shifts. In this Canadian Census lesson plan, students interpret data from the 2006 Census to determine the needs of the Aboriginal population in the country.
Curated OER
Slopey Math
Students identify the slope of a line and use it to solve real life problems. In this algebra lesson, students write linear equations in slope intercept form and make a correlation to its relation to the real world. They use the slope an...
Curated OER
What is the Population Distribution of Cartoon Characters Living On the Pages of Your Newspaper?
Students read various cartoons in their local newspaper and calculate the population demographics, spatial distribution and grouping of the characters. Using this information, they create a population distribution map and share them with...
Curated OER
Scientific Notation II: The Mantissa
Students after completing the Part II (of 2) scientific notation online lab exercises, manipulate and interpret large numbers expressed in the "mantissa and exponent" format of scientific notation.
Curated OER
Scientific Notation I: The Exponent
Learners manipulate and interpret large numbers expressed in the "exponent" format of scientific notation.
Curated OER
FUN WITH MAPS
Fifth graders learn map skills by showing the routes they travel from home to school and using that data to practice map reading and interpreting geographical information.


